Forex indicators used in Technical analysis: MACD, RSI, Ichimoku Kinko Hyo, Equal-channel, Fibonacci lines, Price Levels.
Earn with the help of the trade service on the news Erste News!
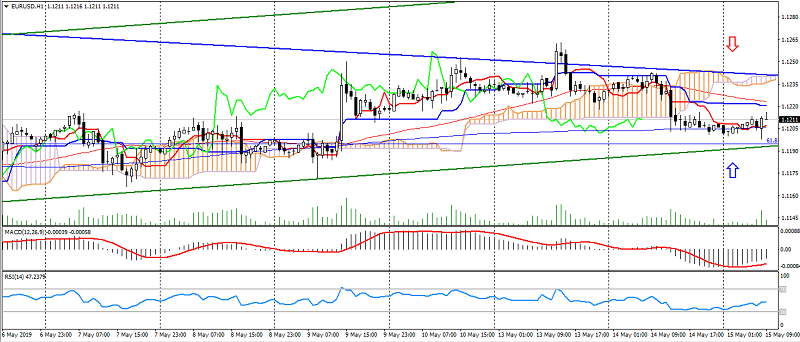
EUR USD (current price: 1.1200)
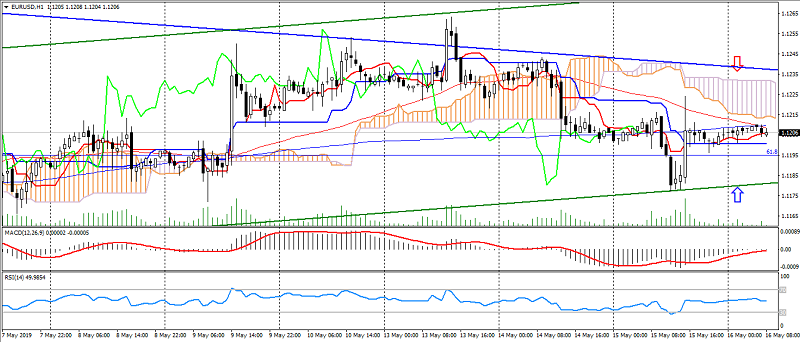
- Support levels: 1.1350, 1.1200, 1.1100.
- Resistance levels: 1.1450, 1.1550, 1.1650.
- Computer analysis: MACD (12, 26, 9) (signal – flat): the indicator near 0 RSI (14) in the neutral zone. Ichimoku Kinko Hyo (9, 26, 52) (signal – downward movement): Tenkan-sen line is above Kijun-sen, the price is below the cloud.
- The main recommendation: sale entry is from 1.1220, 1.1250, 1.1280.
- Alternative recommendation: buy entry is from 1.1180, 1.1160, 1.1140.
A pair of euro dollar is traded restrained in the flat, limited to the side triangle.
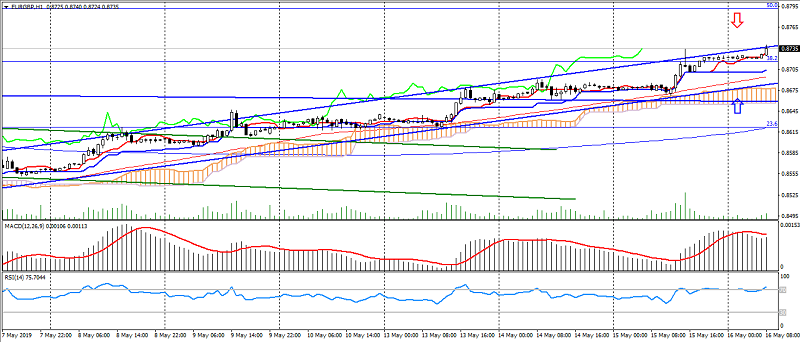
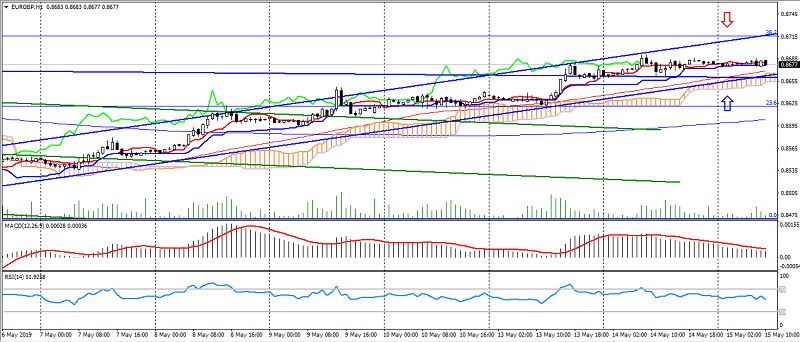
GBP USD (current price: 1.2930)
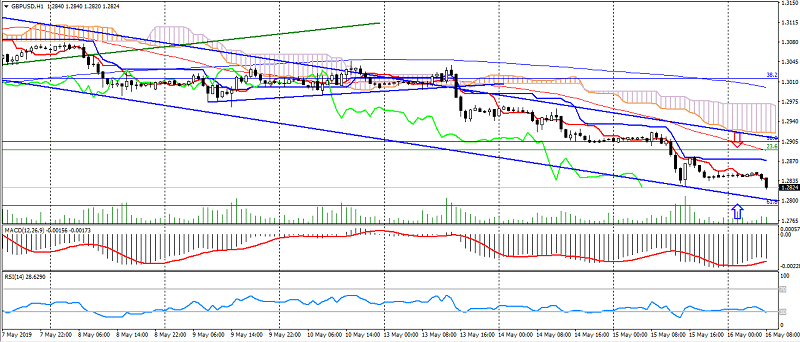
- Support levels: 1.2500, 1.2300, 1.2100.
- Resistance levels: 1.3300, 1.3600, 1.4000.
- Computer analysis: MACD (12, 26, 9) (signal – upward movement): the indicator is below 0, the signal line came out of the histogram body. RSI (14) in the oversold area. Ichimoku Kinko Hyo (9, 26, 52) (signal – downward movement): Tenkan-sen line is below the Kijun-sen line, the price is below the cloud.
- The main recommendation: sale entry is from 1.2880, 1.2900, 1.2940.
- Alternative recommendation: buy entry is from 1.2800, 1.2760, 1.2740.
The British pound trades with a decrease in political risk, limited to divergence and oversold.
USD CHF (current price: 1.0070)
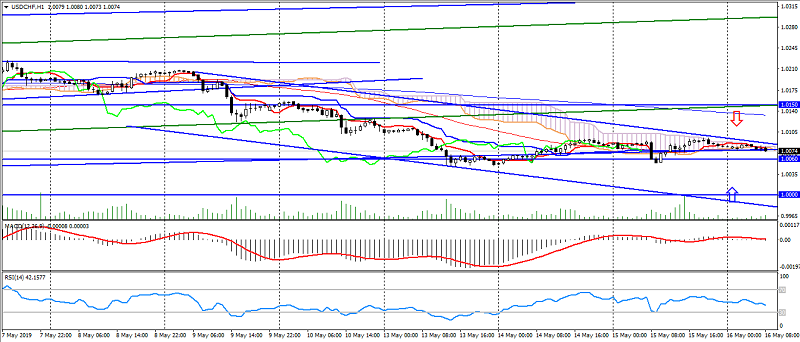
- Support levels: 0.9850, 0.9750, 0.9650.
- Resistance levels: 1.0000, 1.0060, 1.0150.
- Computer analysis: MACD (12, 26, 9) (signal – flat): indicator near 0. RSI (14) in the neutral zone. Ichimoku Kinko Hyo (9, 26, 52) (signal – flat): Tenkan-sen line near Kijun-sen line, the price is in the cloud.
- The main recommendation: sale entry is from 1.0100, 1.0120, 1.0150.
- Alternative recommendation: buy entry is from 1.0040, 1.0020, 1.0000.
The US dollar Swiss franc is moving in flat at a decrease in activity and correction after a decline.
USD JPY (current price: 109.30)
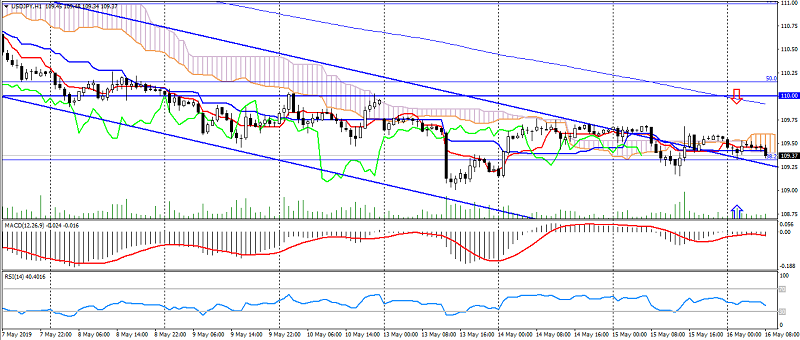
- Support levels: 104.50, 103.00, 100.50.
- Resistance levels: 110.00, 112.00, 115.00.
- Computer analysis: MACD (12, 26, 9) (signal – downward movement): the indicator is below 0, the signal line in the body of the histogram. RSI (14) in the neutral zone. Ichimoku Kinko Hyo (9, 26, 52) (signal – downward movement): Tenkan-sen line near Kijun-sen line, the price is below the cloud.
- The main recommendation: sale entry is from 109.70, 110.00, 110.30.
- Alternative recommendation: buy entry is from 109.20, 109.00, 108.70.
A pair of US dollar the Japanese yen maintains a downward trend in risks, limited to oversold and flat.
USD CAD (current price: 1.3440)
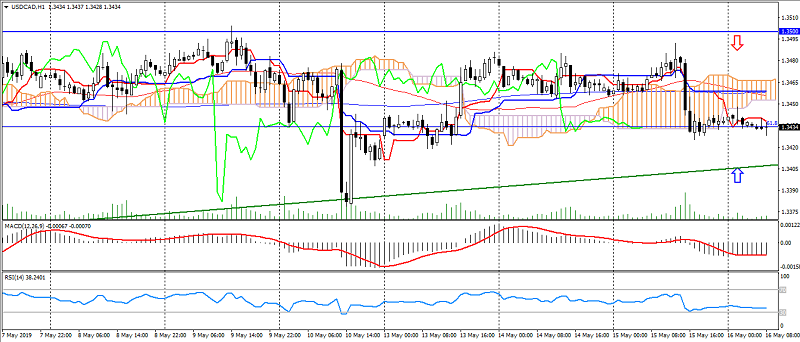
- Support levels: 1.3100, 1.3000, 1.2900.
- Resistance levels: 1.3300, 1.3500, 1.3700.
- Computer analysis: MACD (12, 26, 9) (signal – downward movement): the indicator is below 0, the signal line in the body of the histogram. RSI (14) in the neutral zone. Ichimoku Kinko Hyo (9, 26, 52) (signal – downward movement): Tenkan-sen line is below the Kijun-sen line, the price is below the cloud.
- The main recommendation: sale entry is from 1.3460, 1.3480, 1.3500.
- Alternative recommendation: buy entry is from 1.3420, 1.3380, 1.3350.
The US dollar Canadian dollar pair maintains a moderate dynamic after a weaker the US dollar.
AUD USD (current price: 0.6910)
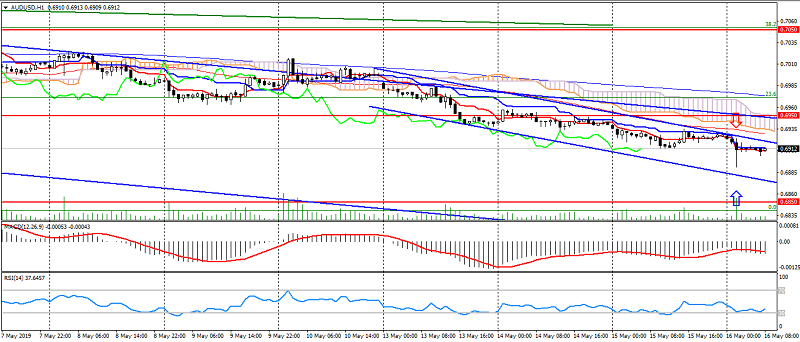
- Support levels: 0.7050, 0.6950, 0.6850.
- Resistance levels: 0.7200, 0.7300, 0.7400.
- Computer analysis: MACD (12, 26, 9) (signal – downward movement): the indicator is below 0, the signal line in the body of the histogram. RSI (14) in the oversold area. Ichimoku Kinko Hyo (9, 26, 52) (signal – downward movement): Tenkan-sen line near Kijun-sen line, the price is below the cloud.
- The main recommendation: sale entry is from 0.6940, 0.6980, 0.7000.
- Alternative recommendation: buy entry is from 0.6900, 0.6880, 0.6850.
The Australian dollar is trading with a moderate decline in risks and weak employment data, while maintaining a downward trading channel.
NZD USD (current price: 0.6560)
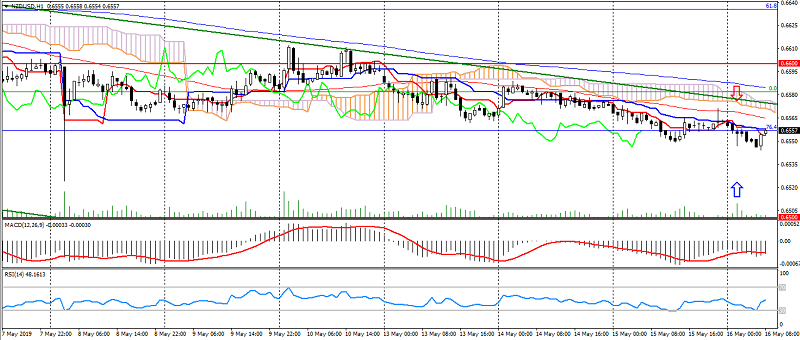
- Support levels : 0.6700, 0.6600, 0.6500.
- Resistance levels: 0.6880, 0.6950, 0.7050.
- Computer analysis: MACD (12, 26, 9) (signal – downward movement): the indicator is below 0, the signal line in the body of the histogram. RSI (14) in the neutral zone. Ichimoku Kinko Hyo (9, 26, 52) (signal – downward movement): Tenkan-sen line near Kijun-sen line, the price is below the cloud.
- The main recommendation: sale entry is from 0.6580, 0.6600, 0.6630.
- Alternative recommendation: buy entry is from 0.6550, 0.6530, 0.6500.
The New Zealand dollar maintains a potential for a decrease in the growth of risks, but at the same time it is trading very restrained.
XAU USD (current price: 1297.00)
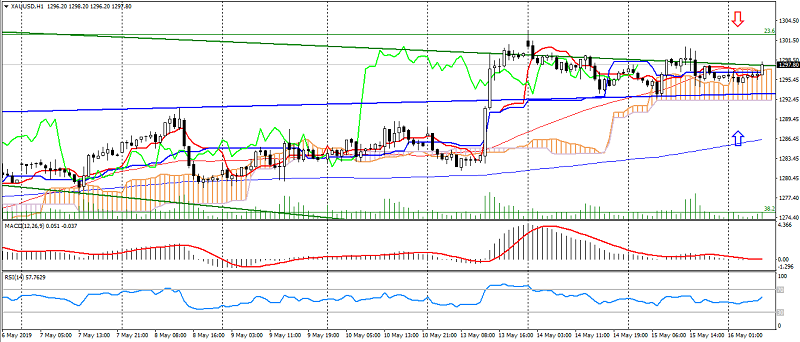
- Support levels: 1300.00, 1335.00, 1360.00.
- Resistance levels: 1265.00, 1240.00, 1220.00.
- Computer analysis: MACD (12, 26, 9) (signal – flat): indicator near 0. RSI (14) in the neutral zone. Ichimoku Kinko Hyo (9, 26, 52) (signal – upward movement): Tenkan-sen line near Kijun-sen line, the price is above the cloud.
- The main recommendation: sale entry is from 1300.00, 1305.00, 1310.00.
- Alternative recommendation: buy entry is from 1295.00, 1290.00, 1285.00.
Gold has resumed growth on risks, limited to psychology 1300.00.