技术分析

Technical analysis of gold and silver (Andre Green)

Forex indicators used in Technical analysis: MACD, RSI, Ichimoku Kinko Hyo, Equal-channel, Fibonacci lines, Price Levels.

Earn with the help of the trade service on the news Erste News!


Gold сhart (current price: $ 1280.00)


Gold slowed the decline in the growth of risk, forming a side triangle.
Technical analysis of oil (Dani Leviant)

Forex indicators used in Technical analysis: MACD, RSI, Ichimoku Kinko Hyo, Equal-channel, Fibonacci lines, Price Levels.

Earn with the help of the trade service on the news Erste News!


Oil quotes have moved to decline in trading on Wednesday. This was due to the persistence of a downtrend and the formation of a correction after growth.

Brent brand chart (current price: $ 69.60)


Brent slowed growth on the correction after growth and maintaining the overall downtrend, limiting itself to a psychological mark of 70.00.

Technical analysis of cross-rates. (Anton Hanzenko)

Forex indicators used in Technical analysis: MACD, RSI, Ichimoku Kinko Hyo, Equal-channel, Fibonacci lines, Price Levels.

Earn with the help of the trade service on the news Erste News!


EUR GBP (current price: 0.8820)

  • Support levels: 0.8900, 0.8850, 0.8750.
  • Resistance levels: 0.9050, 0.9150, 0.9200.
  • Computer analysis: MACD (12, 26, 9) (signal – flat): indicator near 0. RSI (14) in the neutral zone. Ichimoku Kinko Hyo (9, 26, 52) (signal – flat): Tenkan-sen line near Kijun-sen, the price is in the cloud.

Тechnical analysis of currency pairs (Anton Hanzenko)

Forex indicators used in Technical analysis: MACD, RSI, Ichimoku Kinko Hyo, Equal-channel, Fibonacci lines, Price Levels.

Earn with the help of the trade service on the news Erste News!


EUR USD (current price: 1.1160)

  • Support levels: 1.1350, 1.1200, 1.1100.
  • Resistance levels: 1.1450, 1.1550, 1.1650.
  • Computer analysis: MACD (12, 26, 9) (signal – downward movement): the indicator is below 0, the signal line in the body of the histogram. RSI (14) in the neutral zone. Ichimoku Kinko Hyo (9, 26, 52) (signal – downward movement): Tenkan-sen line is lower than Kijun-sen, the price is below the cloud.

Technical analysis of gold and silver (Andre Green)

Forex indicators used in Technical analysis: MACD, RSI, Ichimoku Kinko Hyo, Equal-channel, Fibonacci lines, Price Levels.

Earn with the help of the trade service on the news Erste News!


Gold chart (current price: $ 1282.00)


Gold slowed growth to reduce risks, maintaining the overall downtrend.

Technical analysis of oil (Dani Leviant)

Forex indicators used in Technical analysis: MACD, RSI, Ichimoku Kinko Hyo, Equal-channel, Fibonacci lines, Price Levels.

Earn with the help of the trade service on the news Erste News!


The oil market is trading in different directions after growth on Monday, actually moving on to the correction.

Brent brand chart (current price: $ 69.90)


Brent slowed growth on the correction after growth and maintaining the overall downtrend, limiting itself to a psychological mark of 70.00.

Technical analysis of cross-rates. (Anton Hanzenko)

Forex indicators used in Technical analysis: MACD, RSI, Ichimoku Kinko Hyo, Equal-channel, Fibonacci lines, Price Levels.

Earn with the help of the trade service on the news Erste News!


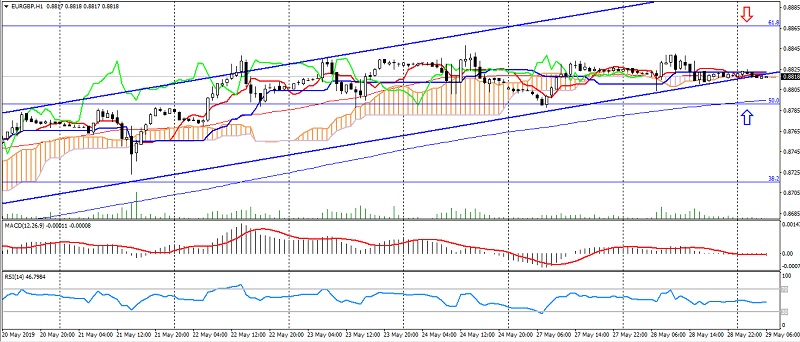
EUR GBP (current price: 0.8800)

  • Support levels: 0.8900, 0.8850, 0.8750.
  • Resistance levels: 0.9050, 0.9150, 0.9200.
  • Computer analysis: MACD (12, 26, 9) (signal – downward movement): the indicator is above 0, the signal line is out of the histogram body. RSI (14) in the neutral zone. Ichimoku Kinko Hyo (9, 26, 52) (signal – downward movement): Tenkan-sen line near Kijun-sen, the price is below the cloud.

Тechnical analysis of currency pairs (Anton Hanzenko)

Forex indicators used in Technical analysis: MACD, RSI, Ichimoku Kinko Hyo, Equal-channel, Fibonacci lines, Price Levels.

Earn with the help of the trade service on the news Erste News!


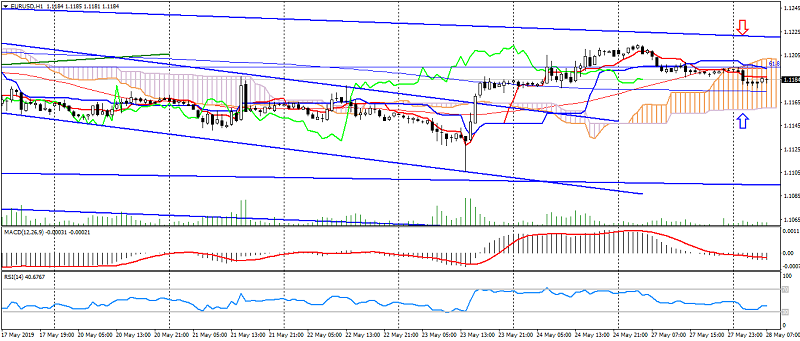
EUR USD (current price: 1.1180)

  • Support levels: 1.1350, 1.1200, 1.1100.
  • Resistance levels: 1.1450, 1.1550, 1.1650.
  • Computer analysis: MACD (12, 26, 9) (signal – downward movement): the indicator is below 0, the signal line in the body of the histogram. RSI (14) in the neutral zone. Ichimoku Kinko Hyo (9, 26, 52) (flat signal): Tenkan-sen line is lower than Kijun-sen, the price is in the cloud.

Technical analysis of gold and silver (Andre Green)

Forex indicators used in Technical analysis: MACD, RSI, Ichimoku Kinko Hyo, Equal-channel, Fibonacci lines, Price Levels.

Earn with the help of the trade service on the news Erste News!


Gold chart (current price: $ 1286.00)


Gold is trading with a strengthening on correction after a decline.