Technical analysis of gold and silver (Andre Green)
Forex indicators used in Technical analysis: MACD, RSI, Ichimoku Kinko Hyo, Equal-channel, Fibonacci lines, Price Levels.
Earn with the help of the trade service on the news Erste News!
Gold chart (current price: $ 1475.00)
Gold maintains growth on uncertainties, in fact, being limited to overbought and trading channels.
Technical analysis of oil (Dani Leviant)
Forex indicators used in Technical analysis: MACD, RSI, Ichimoku Kinko Hyo, Equal-channel, Fibonacci lines, Price Levels.
Earn with the help of the trade service on the news Erste News!
Oil market remains restricted while waiting for the US oil inventories.
Brent brand chart (current price: $ 62.00)
The Brent brand is trading with growth on attempts of correction, limiting itself to the possibility of growth in inventories in the United States.
Technical analysis of cross-rates. (Anton Hanzenko)
Forex indicators used in Technical analysis: MACD, RSI, Ichimoku Kinko Hyo, Equal-channel, Fibonacci lines, Price Levels.
Earn with the help of the trade service on the news Erste News!
EUR GBP (current price: 0.8570)
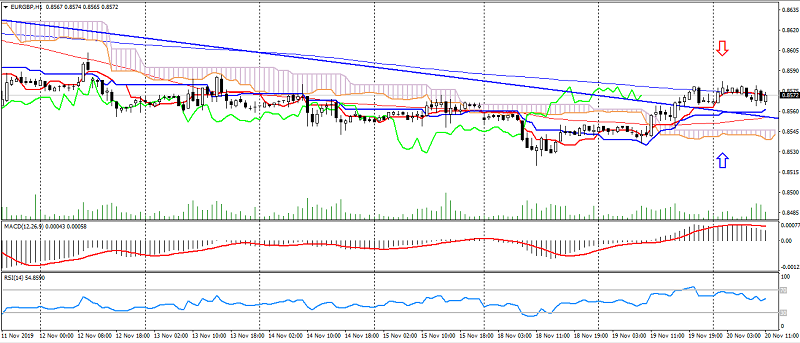
- Support levels: 0.8900, 0.8850, 0.8750.
- Resistance levels: 0.9050, 0.9150, 0.9200.
- Computer analysis: MACD (12, 26, 9) (signal – downward movement): indicator is above 0, the signal line has left the histogram body. RSI (14) in the neutral zone. Ichimoku Kinko Hyo (9, 26, 52) (signal – upward movement): Tenkan-sen line is above Kijun-sen, the price is above the cloud.
Тechnical analysis of currency pairs (Anton Hanzenko)
Forex indicators used in Technical analysis: MACD, RSI, Ichimoku Kinko Hyo, Equal-channel, Fibonacci lines, Price Levels.
Earn with the help of the trade service on the news Erste News!
EUR USD (current price: 1.1060)
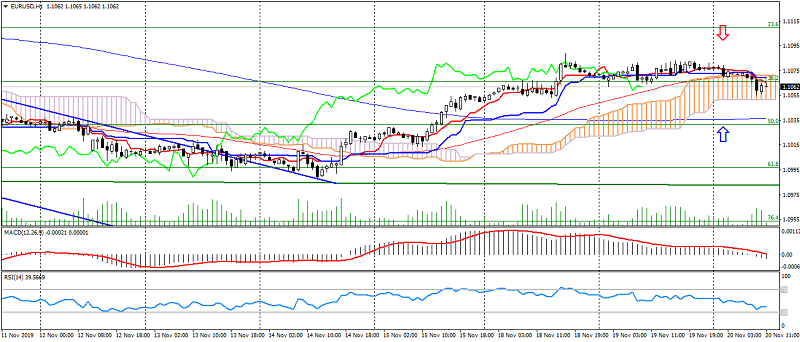
- Support levels: 1.1350, 1.1200, 1.1100.
- Resistance levels: 1.1450, 1.1550, 1.1650.
- Computer analysis: MACD (12, 26, 9) (signal – downward movement): indicator is above 0, the signal line has left the histogram body. RSI (14) in the neutral zone. Ichimoku Kinko Hyo (9, 26, 52) (signal – flat): Tenkan-sen line is below Kijun-sen, the price is below the cloud.
Technical analysis of gold and silver (Andre Green)
Forex indicators used in Technical analysis: MACD, RSI, Ichimoku Kinko Hyo, Equal-channel, Fibonacci lines, Price Levels.
Earn with the help of the trade service on the news Erste News!
Gold chart (current price: $ 1466.00)
Gold remains under the pressure of correction after growth and increased optimism, thereby forming lateral dynamics.
Technical analysis of oil (Dani Leviant)
Forex indicators used in Technical analysis: MACD, RSI, Ichimoku Kinko Hyo, Equal-channel, Fibonacci lines, Price Levels.
Earn with the help of the trade service on the news Erste News!
The oil market remains under the pressure from uncertainty around the US – China trade agreement between.
Brent brand chart (current price: $ 62.00)
The Brent brand is trading at the opening of the day level, remaining under the pressure of trading risks and attempts of correction after growth.
Technical analysis of cross-rates. (Anton Hanzenko)
Forex indicators used in Technical analysis: MACD, RSI, Ichimoku Kinko Hyo, Equal-channel, Fibonacci lines, Price Levels.
Earn with the help of the trade service on the news Erste News!
EUR GBP (current price: 0.8550)
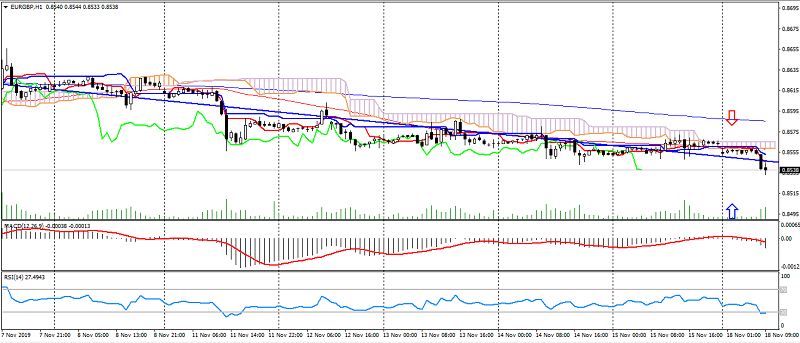
- Support levels: 0.8900, 0.8850, 0.8750.
- Resistance levels: 0.9050, 0.9150, 0.9200.
- Computer analysis: MACD (12, 26, 9) (signal – downward movement): indicator below 0, signal line in the histogram body. RSI (14) in the neutral zone. Ichimoku Kinko Hyo (9, 26, 52) (signal – downward movement): Tenkan-sen line is above Kijun-sen, the price is below the cloud.
Тechnical analysis of currency pairs (Anton Hanzenko)
Forex indicators used in Technical analysis: MACD, RSI, Ichimoku Kinko Hyo, Equal-channel, Fibonacci lines, Price Levels.
Earn with the help of the trade service on the news Erste News!
EUR USD (current price: 1.1060)
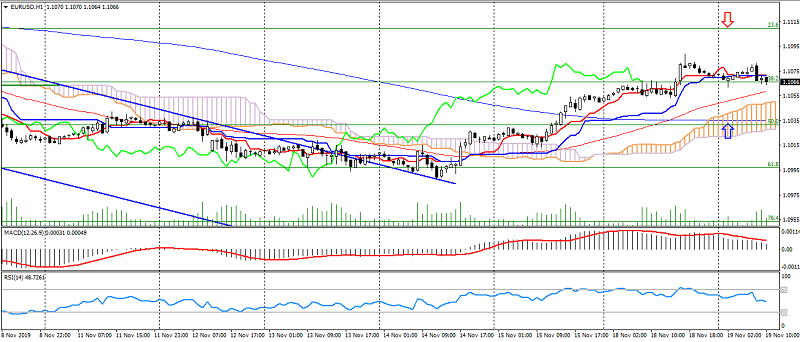
- Support levels: 1.1350, 1.1200, 1.1100.
- Resistance levels: 1.1450, 1.1550, 1.1650.
- Computer analysis: MACD (12, 26, 9) (signal – downward movement): indicator is above 0, the signal line has left the histogram body. RSI (14) in the neutral zone. Ichimoku Kinko Hyo (9, 26, 52) (signal – upward movement): Tenkan-sen line near Kijun-sen, the price is above the cloud.