
Cycles Theory in the FOREX market. Briefly about everything.
Market Cycles Theory is a very extensive science, including many concepts and theories. Many strategies and theories such as the Eliot Wave Theory and more simple technical analysis figures are based on the cycles theory. All of them are connected with the cycles theory to some extent.
I would like to specify from start the main drawback of the cycles theory – the absence of symmetry, which makes the application of this theory in life increasingly complicated, because the examples coincide with real life very rarely. Bearing in mind the fact that the MARKET TAKES INTO ACCOUNT EVERYTHING, such a small thing as symmetry would break immediately in the market realities. The slightest statement by the head of the Central Bank, changes in macroeconomic indicators, political scandals, or even the possibility of any risks will be immediately taken into account by the market. And this is a tiny part of what affects the market and hamper seriously to the correct work of the cycles theory.
But, despite the tar barrel, a spoon of honey in this theory remains. And the possible market errors in the cycles theory shift to a more significant trend what is determined by the above factors.
J.M. Hurst, who published the book “The Profit Magic of Stock Transaction Timing” in 1970 considered as the founder of the cycles theory. The book became the basis for this theory. We will not go deeper into these theories in this publication.
Consider the basic concept of the cycles theory in the formation of a trend, which can respond to both major trends on the daily and weekly charts, and small ones, up to the minute chart.
The cycle theory identifies five phases of one cycle:
- introduction (accumulation)
- growth (main movement),
- maturity (main movement),
- saturation (maximum formation)
- and rollback (correction).
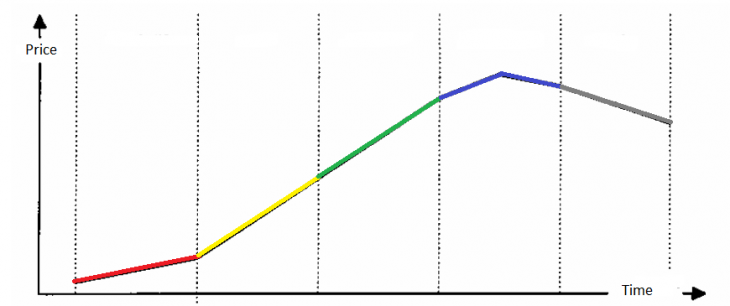
The red line is an introduction, the yellow line is growth, the green line is maturity, the blue line is saturation, the gray line is rollback.
This model is the same, applicable for both the uptrend and downtrend.
The introduction phase (accumulation) is characterized by a relative flat. In this phase, there is a certain confrontation between buyers and sellers, the victory of one of the participants ultimately determines the further trend.
Growth (main movement) – a strong movement of the developing trend. Often in this phase there are fundamental factors or news that give impetus to the market.
Maturity (main movement) corresponds to the main movement, as a rule, here is the maximum trading volume. It may even accelerate the movement of the trend.
Saturation (formation of a maximum) indicates that the trend is coming to a logical end and correction should be expected. In this phase, an extremum is formed, which can later be a significant level.
Rollback (correction) – the end of the trend, indicating the end of this movement and the expectation of the formation of a new trend. A rollback is an integral part of any trend that, due to circumstances, can show itself in different ways.
Most of the movements of the Forex market are built on the example of this cycle, but due to circumstances they have their own characteristics that only schematically correspond to this model of movement. Even on the basis of this model, you can form your own strategy or improve the existing one.
Anton Hanzenko