Market activity depending on the days of the week
Earlier, we talked about the features of trading on a particular day of the week on the example of Monday and Friday. Market activity on different days of the week is really different. However I would like to describepatterns of market behavior throughout the week more detailed .
Drawing a parallel with the market behavior throughout the week and with common patterns of market movement we see that the most similar are the pattern of movement of any trend, which was already mentioned in the Dow theory.
Drawing an analogy between the days of the week and the Dow’s trend theory the days of the week can be divided in the following phases of the trend.
- Monday
On Monday, accumulation (accumulation) of trading volumes after the weekend falls. During this period, market participants return to the market after the break and begin to open deals, depending on existing factors. As a result, the trading volume returns to the market and a certain trend is created.
- Tuesday
On Tuesday, there is a transition from the accumulation to the start of participation. It responds to the beginning of the direct movement, which in turn is not confident and very weakly expressed. At the same time, trading volumes reach a normal level. A weekly trend is forming during this period – the end of Monday and the beginning of Tuesday. Best time to enter a transaction.
- Wednesday
The main movement of the market often falls on Wednesday. It is determined by unidirectional movement. According to statistics the maximum trading volume are on Wednesday the middle of the week. What causes the movement in the market.
- Thursday
Thursday can be called the phase of saturation of the market and working out the main goals. At the same time during this period extremes will be reached. It corresponds to a gradual decrease in volumes and as a result a decrease in the strength of the trend. A flat is formed, which ultimately indicates a correction. Time to take profits.
- Friday
Friday is the second stage of the saturation, correction. The market changes the direction of movement and corrects the position after the movement. It is due to the fact that many investors close deals before the weekend.

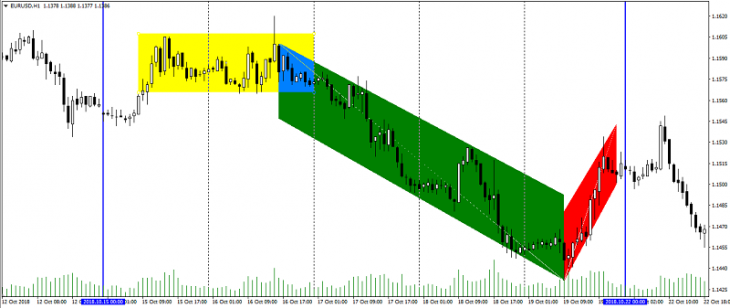
The figure above is an example of the weekly movement of the EUR/USD pair (10.15.2018-22.10.2018). Where the main phases of the trend are traced: the yellow zone is accumulation, the green zone is participation, the red zone is saturation.
Of course, for many reasons, such a market movement is very rare, but this model is inherent in any week to one degree or another. It is worth noting that there are no clear boundaries in phases, as it is in days. Also do not forget about intraday trading sessions, which also have its own patterns of movement. And of course about the fundamental factors that make adjustments to any pattern of market movement.
Anton Hanzenko