Time of change for EURO. Trend or breakdown? To be or not to be?
Good afternoon, my dear). Andrew Green, your permanent helmsman in the stormy ocean of the financial market, is back with you.
Let’s start the week, perhaps with a brief analysis of the EUR/USD pair.
Here we focus on the trend channel of the maximum timeframe for the MT4 platform – the monthly one. As we can see in Figure 1, a downward trend channel has emerged here, starting from the 2008 highs and a turning point for the European economic system and the entire world economy – the global economic crisis of 2008.
The main issues at the cost of billions of dollars), what will happen next?
- will the re-test 1.2700 be this year?
- will the downward trend continue or not?
- in case of breakdown, how much will the EURO general dynamics of the market grow up?
I have no purpose to answer all these questions within the framework of this article, but I can mention several important fundamental factors.
- Good overall support for the overall dynamics of the European single currency against the American is provided by the improving, in its majority, economic indicators of individual Eurozone entities: Germany, France, Italy, and countries of northern Europe.
- Also, the general policy of the European Central Bank, which is further aimed at reducing the volume of quantitative easing and tightening monetary policy in the euro area.
- As a positive factor, we should also take into account the situation with the threat of a default in Greece, a prolonged stagnation in the Italian economy, and an improving pace of development in countries such as Spain and Portugal.
But in this barrel of honey, there are still a couple of spoons of tar:
- uncertainty in the matter of further economic sanctions against Russia;
- the growing number of conflicts associated with the desire of individual areas of sovereign European states (Spain, Italy) to have great opportunities for local government, right up to independence (Catalonia);
- the withdrawal of Britain from the European union, and the lack of a clear agreement on a further format of cooperation.
In a word, there is something to shatter your brains at your leisure. And this despite the fact that I have not yet touched on a huge amount of fundamental analysis of the situation in the US). But, for the current trade, I certainly would recommend focusing on technical analysis.
In fact, based on what we observe on the monthly period, the probability of a reversal and the maintenance of the main trend exceeds the likelihood of a reversal.
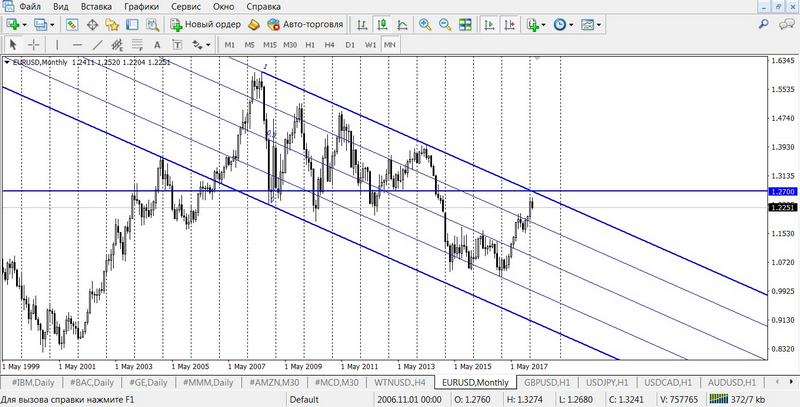
After the first decade of February, a clear descending candle with a possible reversal is formed, although, of course, a turn from 1.2700 would be more attractive. According to the laws of trend analysis – we trade on the trend, since the probability of its continuation always exceeds the probability of a reversal. For beginning traders and those who are interested in the general rules of trading on the market, I recommend going through a basic training course to familiarize yourself with all the laws of trend analysis and the basic principles of technical analysis in financial markets. You can find out more about this training course in the corresponding section on the website of the partner company Ester Holdings.
[maxbutton id = “2” url = “https://esterholdings.com/en/learning/paid-training/modul-basic/#modal-1” text = “JOIN THE COURSE!” ]
We proceed to the day time frame. Here we have a well-established triangle and the main dynamics, still, in the ascending channel.
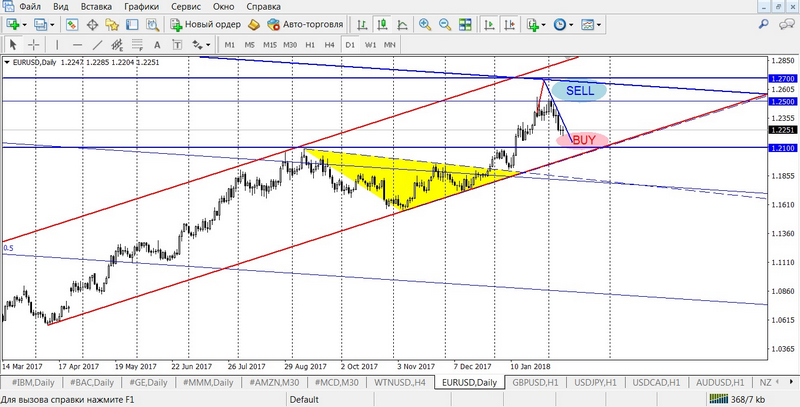
The main zone of resistance is the range of 1.2700-1.2500. For medium-term trading, I recommend trading in this zone on SELL with averaging, the averaging range is 50 pp. In turn, zone 1.2100 is very attractive for further purchases, there are placed in large quantities pending orders of “bull” market participants. Although, it is worth considering the potential of the senior (monthly) trend, which I wrote about earlier. But the option of trading on BUY does not exclude, with averaging in the range of 30-40 points, but with a cut-off area of 1.1950.
For current trade and immediate recommendations for IntraDay, go to H1.
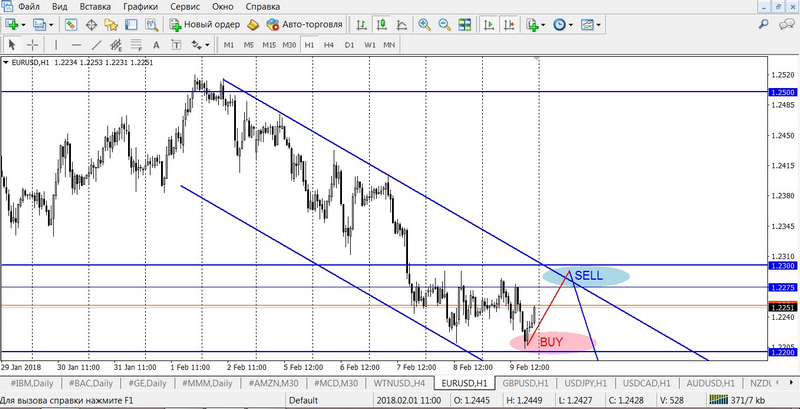
The chart has formed a downward trend and the nearest reference point for trading in it – sales from 1.2300-1.2270. The option of purchases from 1.2200 can be considered only in case of correction BEFORE the moment of reaching the blue zone of sales. In the case of the rite of 1.2300-1.2270 and a turn for a decrease, the probability of breakdown is very high. Purchases from the red zone are possible only with a short stop loss of no more than 30 points.
Examples of transactions:
- SELL limit 1.2270, SL 1.2330, TP 1.2205
- BUY limit 1.2205, SL 1.2180, TP 1.2260
Have a good start to the trading week! If there is a desire to consult on the current trade, write to the technical support address of the partner company Ester support@esterholdings.com, marked “for Andrew Green”.
Nothing so does not improve the weather outside the window, like a closed deal in time.
Let the sun and a good mood always be on your financial horizons.
Andrew Green