
Technical analysis of gold and silver (Alexander Sivtsov)
Gold chart (current price: $ 1340.30)
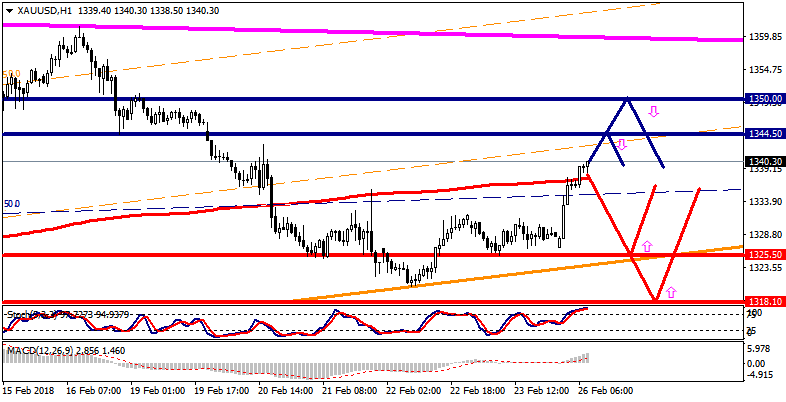
Gold is traded above the zero mark during the Asian session.
- Resistance 1: From $ 1344.50 (February 16 minimum)
- Resistance 2: From $ 1350.00 (technical level)
- Support 1: From $ 1325.50 (February 23 minimum)
- Support 2: From $ 1318.10 (February 14 minimum)
Computer analysis: The Stochastic Oscillator movings on the chart H1 indicate overbought of the instrument, against which a decline in the price of gold is possible.
Silver chart (current price: $ 16.69)
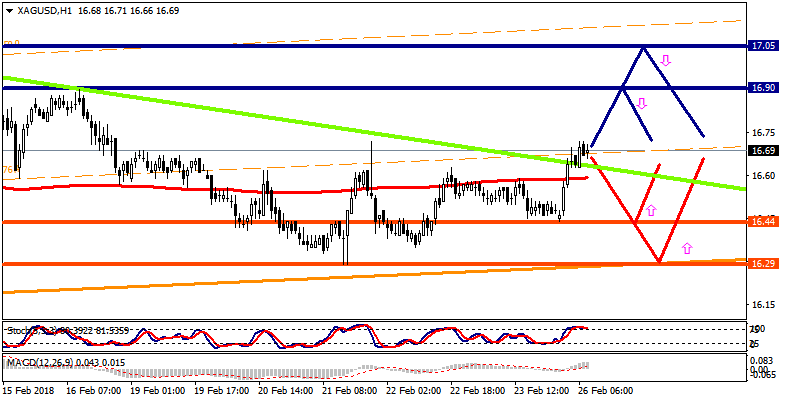
Silver is traded with a plus during the Asian session.
- Resistance 1: From $ 16.90 (technical level)
- Resistance 2: From $ 17.05 (technical level)
- Support 1: From $ 16.44 (February 23 minimum)
- Support 2: From $ 16.29 (February 21 minimum)
Computer analysis: The Stochastic Oscillator movings on the H1 chart indicate overbought of the instrument, there may be some decrease in the price of silver.