
Technical analysis of gold and silver (Alexander Sivtsov)
Gold chart (current price: $ 1326.70)
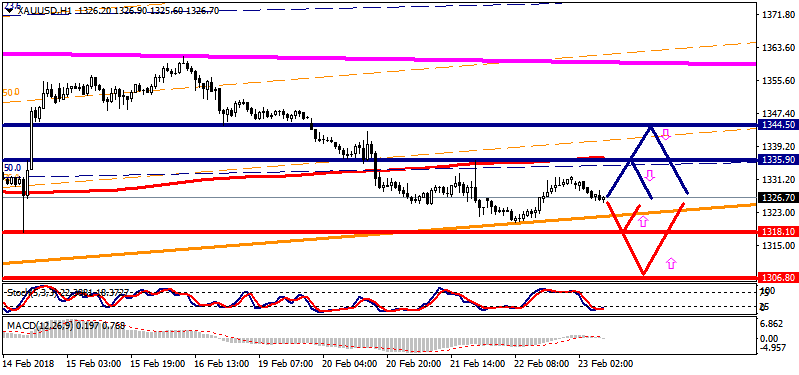
Gold is traded below the zero mark during the Asian session.
- Resistance 1: From $ 1335.90 (February 21 maximum)
- Resistance 2: From $ 1344.50 (February 16 minimum)
- Support 1: From $ 1318.10 (February 14 minimum)
- Support 2: From $ 1306.80 (February 8 minimum)
Computer analysis: The Stochastic Oscillator movings on the chart H1 indicate oversold of the instrument, against which the resumption of the growth of the price of gold is possible.
Silver chart (current price: $ 16.54)
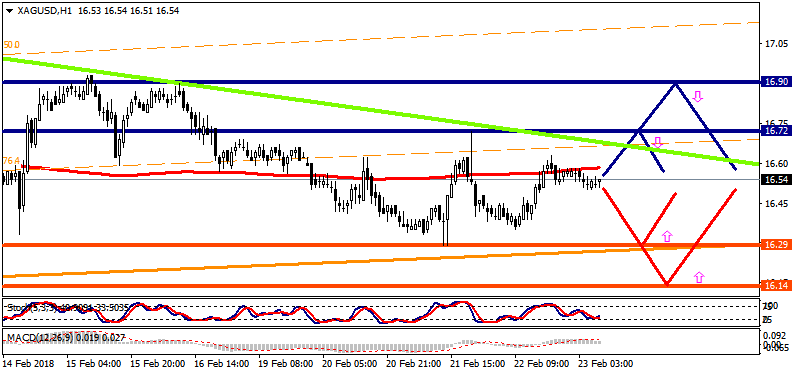
Silver is traded with a minus during the Asian session.
- Resistance 1: From $ 16.72 (February 21 maximum)
- Resistance 2: From $ 16.90 (technical level)
- Support 1: From $ 16.29 (February 21 minimum)
- Support 2: From $ 16.14 (February 9 minimum)
Computer analysis: The Stochastic Oscillator movings on the charts of H1 and H4 are in the neutral zone, so the continuation of the consolidation of the price of silver is possible.