
Technical analysis of gold and silver (Alexander Sivtsov)
Gold chart (current price: $ 1325.10)

Gold is traded with a small plus during the Asian session.
- Resistance 1: From $ 1345.80 (February 6 maximum)
- Resistance 2: From $ 1356.80 (January 26 maximum)
- Support 1: From $ 1309.00 (technical level)
- Support 2: From $ 1300.00 (psychological level)
Computer analysis: The Stochastic Oscillator movings on the charts of H1 and H4 indicate overbought of the instrument, a decline in the price of gold is possible.
Silver chart (current price: $ 16.57)
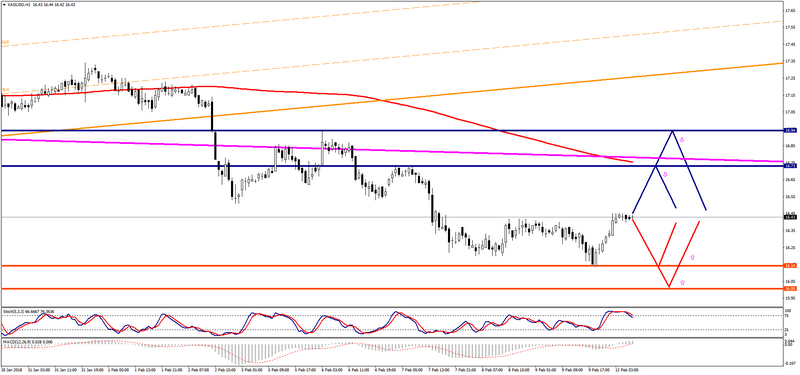
Silver is traded near the zero mark during the Asian session.
- Resistance 1: From $ 16.94 (February 6 maximum)
- Resistance 2: From $ 17.05 (February 1 minimum)
- Support 1: From $ 16.14 (February 9 minimum)
- Support 2: From $ 16.00 (psychological level)
Computer analysis: The Stochastic Oscillator movings on the charts of H1 and H4 indicate overbought of the instrument, against which a reduction in the price of silver is possible.