
Technical analysis of gold and silver (Alexander Sivtsov)
Gold chart (current price: $ 1355.00)
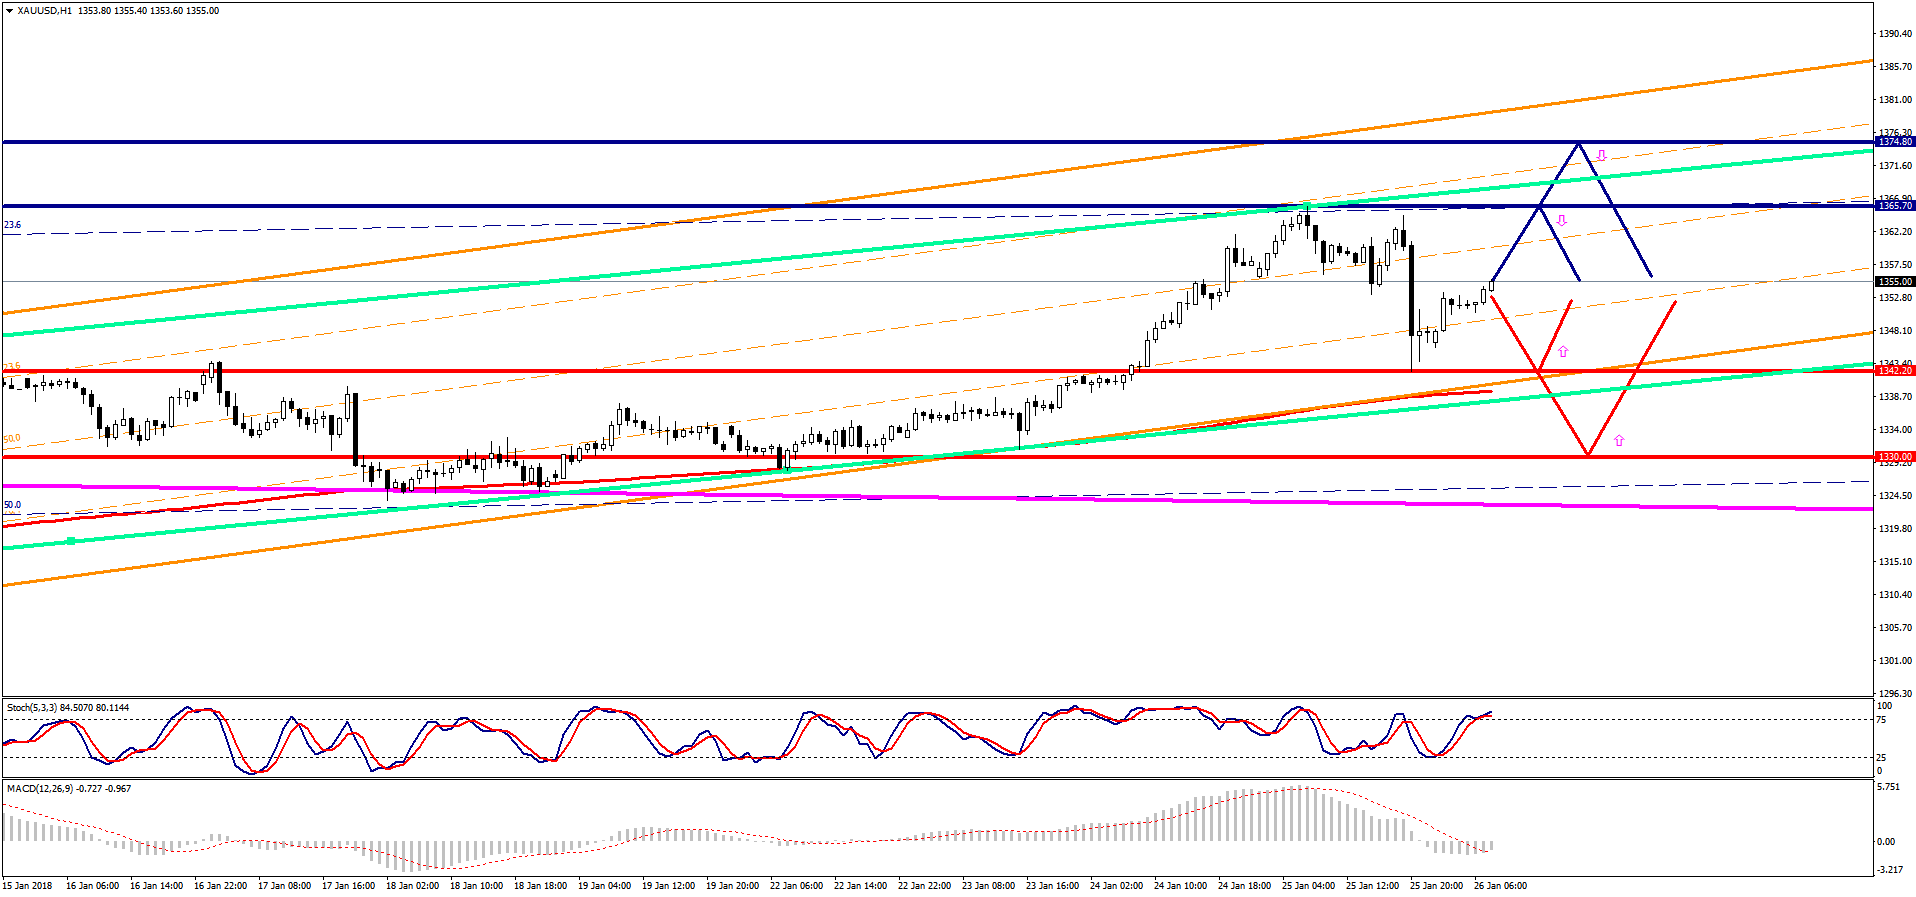
Gold is traded above the zero mark during the Asian session.
- Resistance 1: From $ 1365.70 (January 25 maximum)
- Resistance 2: From $ 1374.80 (2016 maximum)
- Support 1: From $ 1342.20 (January 25 minimum)
- Support 2: From $ 1330.00 (technical level)
Computer analysis: The Stochastic Oscillator movings on the H4 chart are in the neutral zone, one should expect consolidation of the price of gold.
Silver chart (current price: $ 17.44)
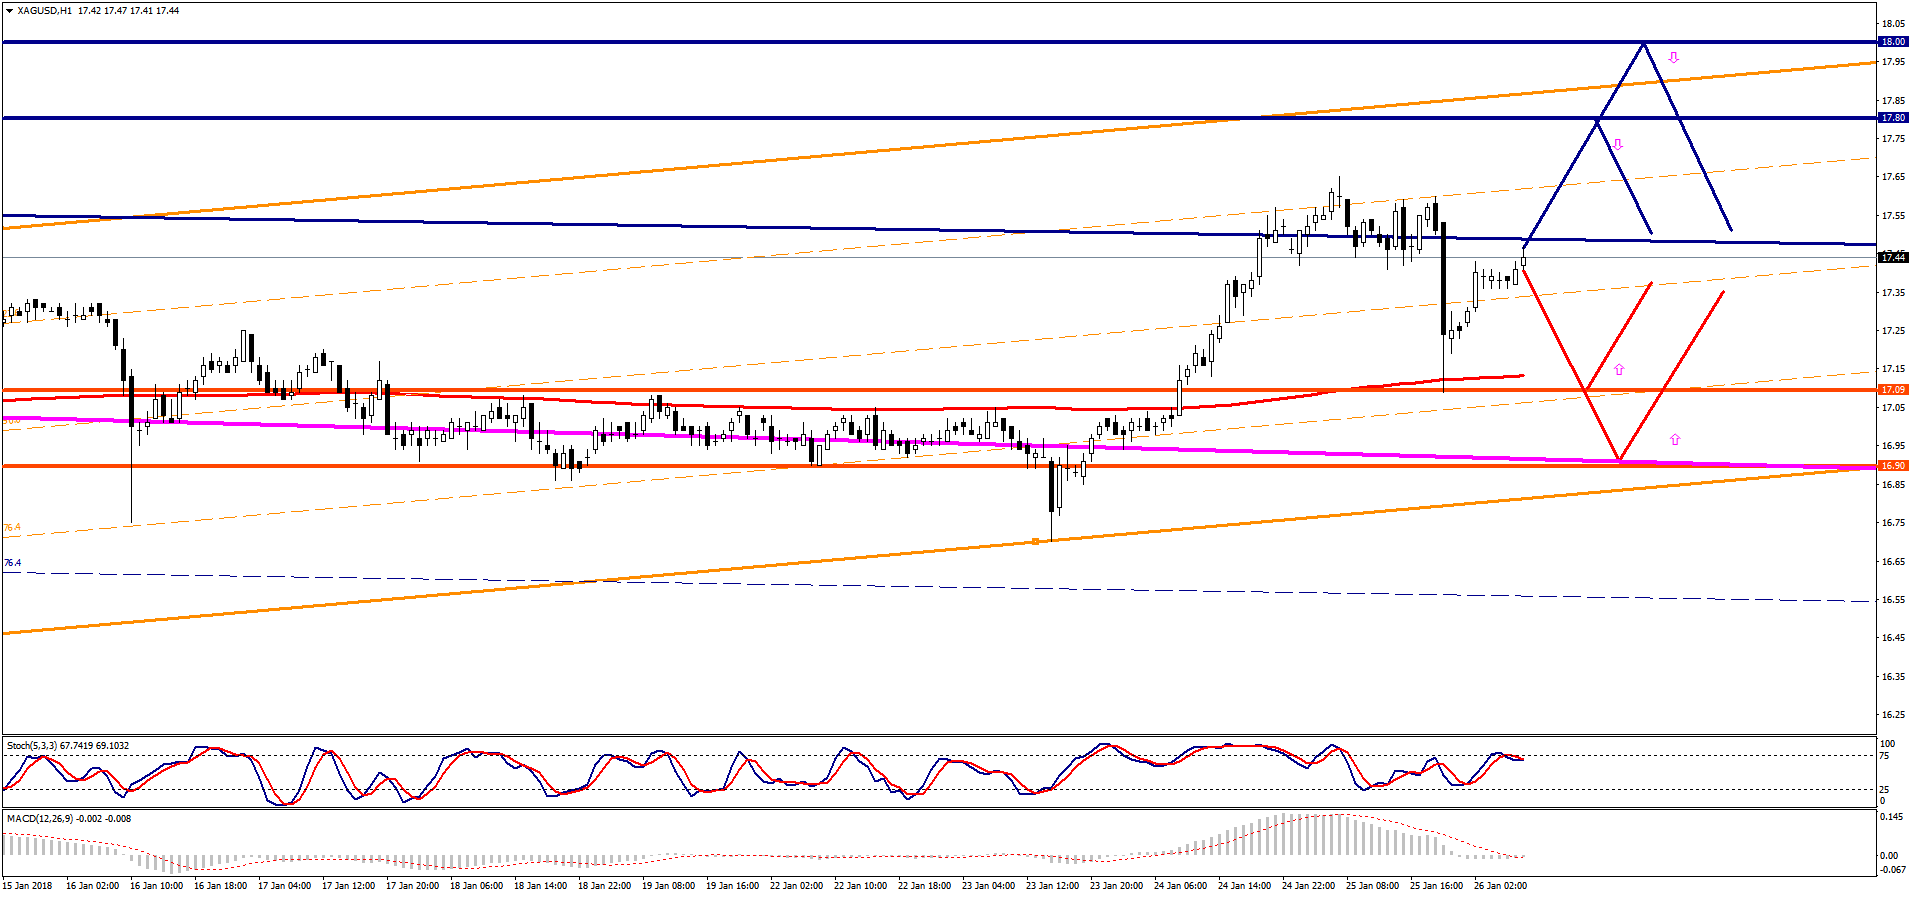
Silver is traded with a plus during the Asian session.
- Resistance 1: From $ 17.80 (technical level)
- Resistance 2: From $ 18.00 (psychological level)
- Support 1: From $ 17.09 (January 25 minimum)
- Support 2: From $ 16.90 (technical level)
Computer analysis: The Stochastic Oscillator movings on the H4 chart are in the neutral zone, silver price movement is possible in a narrow range.