
Technical analysis of gold and silver (Alexander Sivtsov)
Gold chart (current price: $ 1336.60)
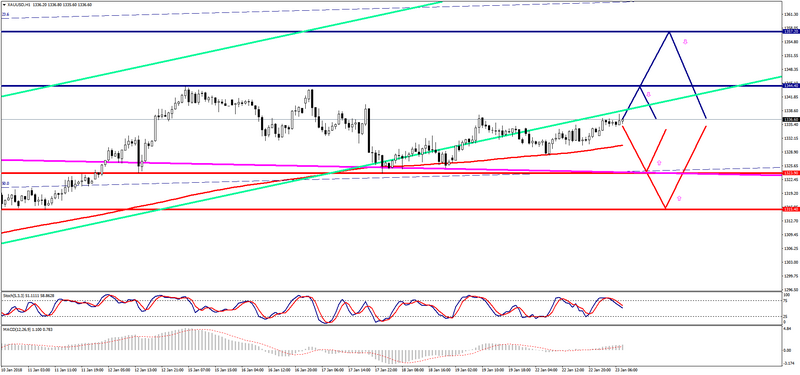
Gold is traded above the zero mark during the Asian session.
- Resistance 1: From $ 1344.40 (January 15 maximum)
- Resistance 2: From $ 1357.20 (September 8 maximum)
- Support 1: From $ 1323.90 (January 18 minimum)
- Support 2: From $ 1315.40 (January 11 minimum)
Computer analysis: The Stochastic Oscillator movings on the H1 chart are in the neutral zone. That is why one should expect the consolidation of the gold price.
Silver chart (current price: $ 17.03)
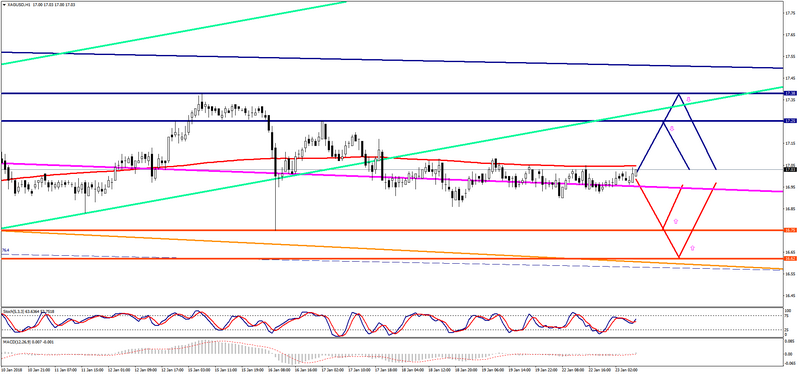
Silver is traded with a plus during the Asian session.
- Resistance 1: From $ 17.25 (January 17 maximum)
- Resistance 2: From $ 17.38 (January 15 maximum)
- Support 1: From $ 16.75 (January 16 minimum)
- Support 2: From $ 16.62 (technical level)
Computer analysis: The Stochastic Oscillator movings on the H1 chart are in the neutral zone, so the price of silver can continue to move in a narrow range.