
Technical analysis of gold and silver (Alexander Sivtsov)
Gold chart (current price: $ 1338.50)
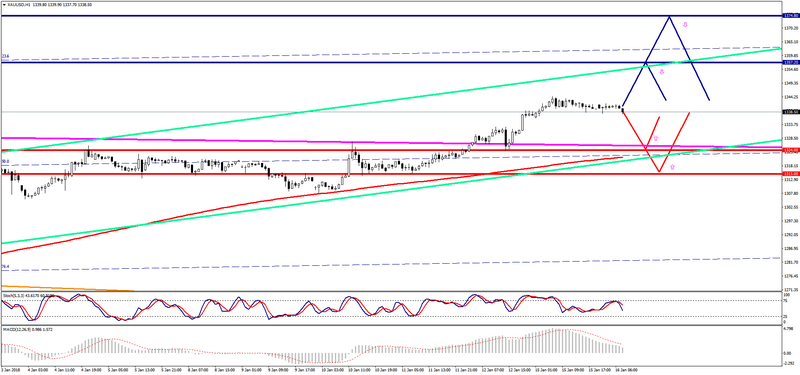
Gold is traded above the zero mark during the Asian session.
- Resistance 1: From $ 1357.20 (September 8 maximum)
- Resistance 2: From $ 1374.80 (2016 maximum)
- Support 1: From $ 1324.00 (technical level)
- Support 2: From $ 1315.00 (technical level)
Computer analysis: on the chart of H1 the MACD indicator forms a bearish divergence, so there may be some decrease in the price of gold.
Silver chart (current price: $ 17.22)
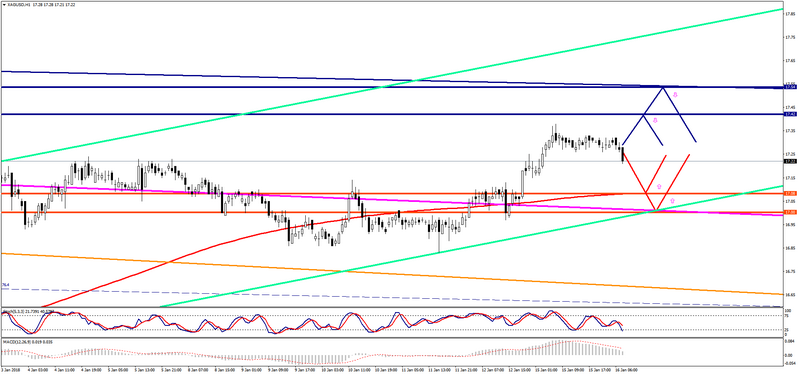
Silver is traded with a plus during the Asian session.
- Resistance 1: From $ 17.42 (October 16 maximum)
- Resistance 2: From $ 17.54 (resistance line of Low channel on D1)
- Support 1: From $ 17.08 (MA 200 on H1)
- Support 2: From $ 17.00 (psychological level)
Computer analysis: on the chart of H1 the MACD indicator also indicates a bearish divergence, so the situation may be similar to gold.