
Technical analysis of gold and silver (Alexander Sivtsov)
Gold chart (current price: $ 1328.10)
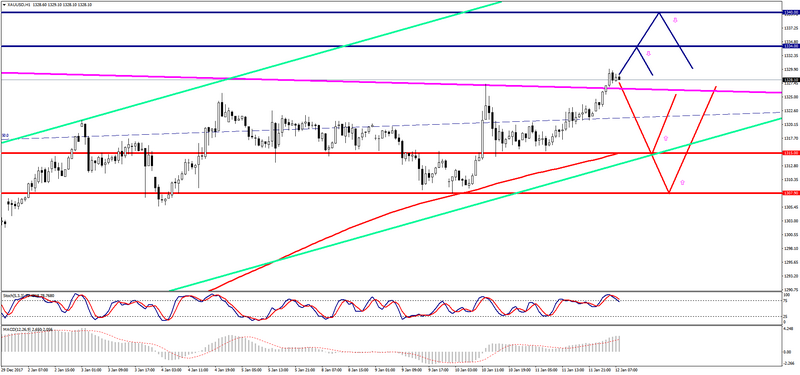
Gold is trading above the zero mark during the Asian session.
- Resistance 1: From $ 1334.00 (technical level)
- Resistance 2: From $ 1340.00 (technical level)
- Support 1: From $ 1315.00 (MA 200 on H1)
- Support 2: From $ 1307.90 (January 10 minimum)
Computer analysis: The Stochastic Oscillator movings on the chart of H1 indicate overbought of the instrument, so there may be some reduction in the gold price.
Silver chart (current price: $ 17.07)
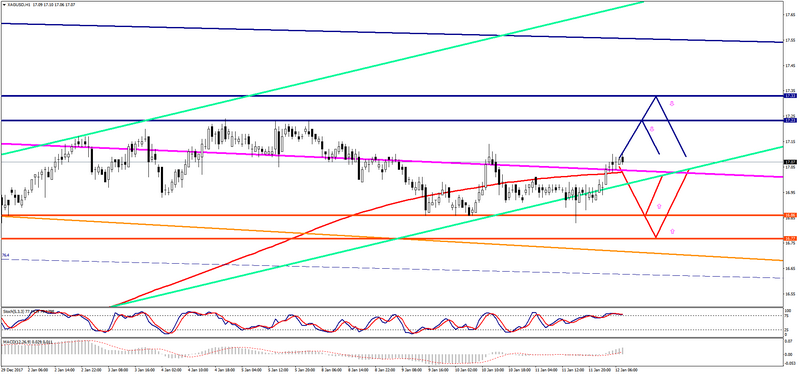
Silver is traded with a plus during the Asian session.
- Resistance 1: From $ 17.23 (January 8 maximum)
- Resistance 2: From $ 17.33 (November 17 maximum)
- Support 1: From $ 16.86 (January 10 minimum)
- Support 2: From $ 16.77 (December 29 minimum)
Computer analysis: The Stochastic Oscillator movings on the chart H1 indicate overbought of the instrument, one should expect some reduction in the price of silver.