
Technical analysis of gold and silver (Alexander Sivtsov)
Gold chart (current price: $ 1248.10)
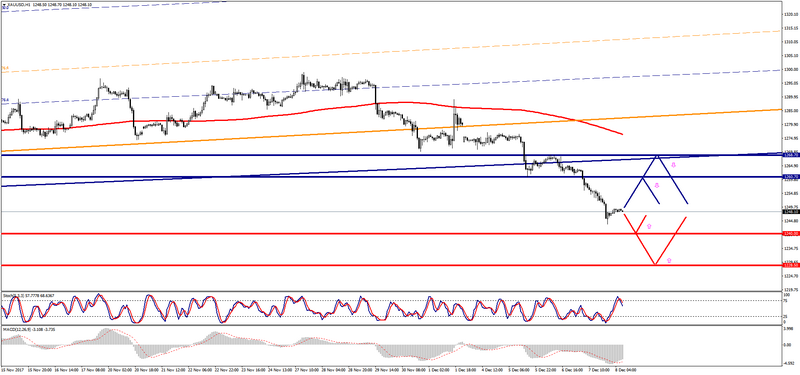
Gold is trading below the zero mark during the Asian session.
- Resistance 1: From $ 1260.70 (December 5 minimum)
- Resistance 2: From $ 1268.70 (December 6 maximum)
- Support 1: From $ 1240.00 (technical level)
- Support 2: From $ 1228.50 (technical level)
Computer analysis: The Stochastic Oscillator movings on the H1 chart indicate overbought of the instrument, that is why there may be a further decline in the price of gold.
Silver Schedule (current price: $ 15.74)
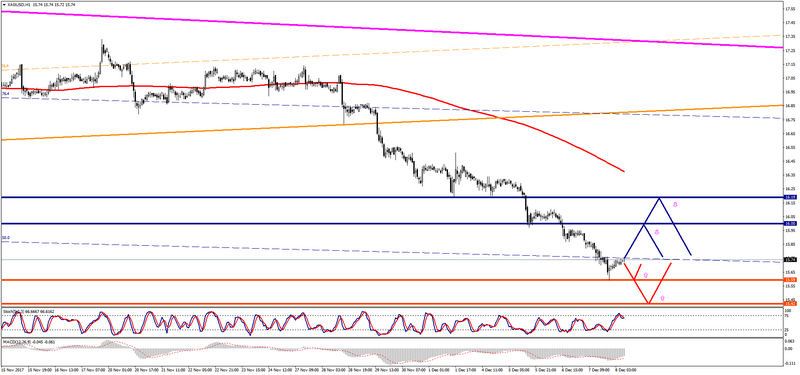
Silver is trading with a minus during the Asian session.
- Resistance 1: From $ 16.00 (psychological level)
- Resistance 2: From $ 16.19 (December 4 maximum)
- Support 1: From $ 15.59 (December 7 minimum)
- Support 2: From $ 15.42 (July 11 minimum)
Computer analysis: The Stochastic Oscillator movings on the H1 chart indicate overbought of the instrument, which is why further decline in the price of silver is possible.