
Technical analysis of gold and silver (Alexander Sivtsov)
Gold chart (current price: $ 1268.20)
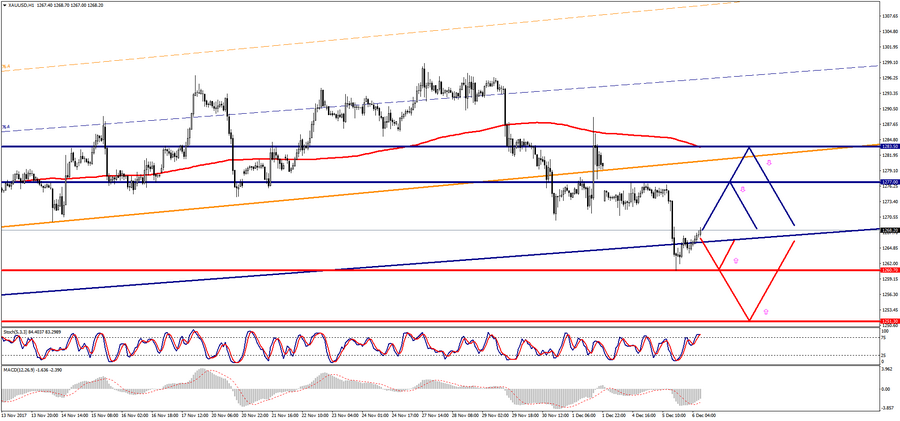
Gold is trading above the zero mark during the Asian session.
- Resistance 1: From $ 1277.00 (December 4 maximum)
- Resistance 2: From $ 1283.50 (MA 200 on H1)
- Support 1: From $ 1260.70 (December 5 minimum)
- Support 2: From $ 1251.30 (August 8 minimum)
Computer analysis: The Stochastic Oscillator movings on the D1 chart indicate oversold of the instrument, therefore further recovery of the gold price is possible.
Silver chart (current price: $ 16.07)
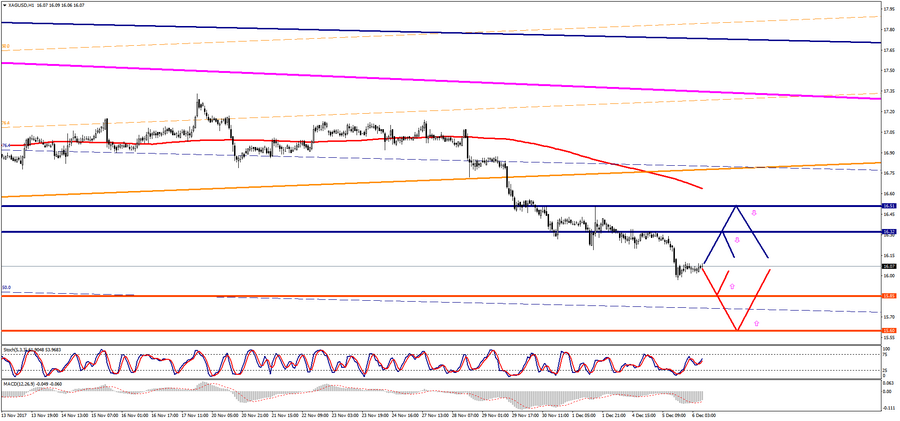
Silver is trading with a plus during the Asian session.
- Resistance 1: From $ 16.32 (December 5 maximum)
- Resistance 2: From $ 16.51 (December 1 maximum)
- Support 1: From $ 15.85 (technical level)
- Support 2: From $ 15.60 (technical level)
Computer analysis: The Stochastic Oscillator movings on the D1 chart indicate the oversold of the instrument. That is why one should expect a recovery of the silver price.