
Technical analysis of gold and silver (Alexander Sivtsov)
Gold chart (current price: $ 1278.70)
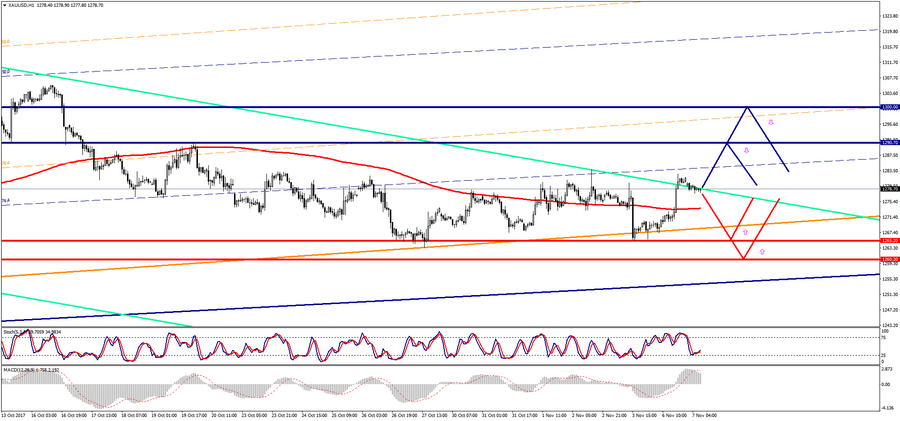
Gold is trading with a small minus during the Asian session.
Resistance 1: From $ 1290.70 (October 20 maximum)
Resistance 2: From $ 1300.00 (psychological level)
Support 1: From $ 1265.20 (November 3 minimum)
Support 2: From $ 1260.30 (October 6 minimum)
Computer analysis: Gold continues to move in a predominantly flat in the short term, the Stochastic Oscillator movings on the D1 chart are in the neutral zone. One should expect a continuation of the flat movement on gold.
Silver chart (current price: $ 17.09)
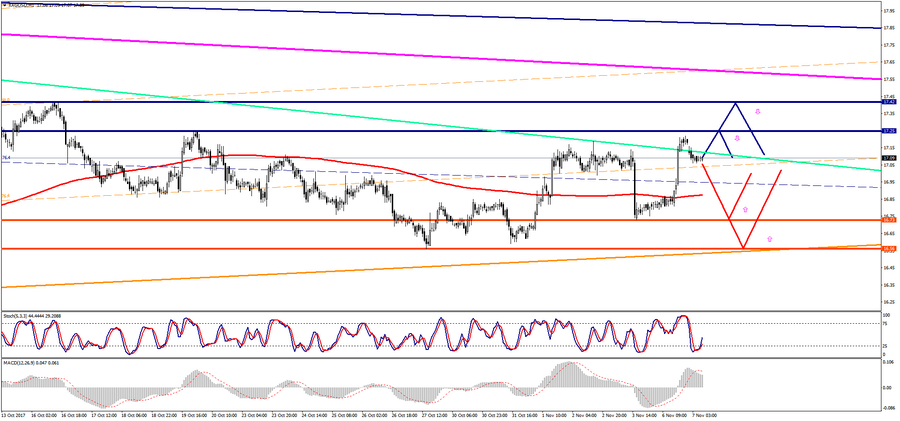
Silver is trading below the zero mark during the Asian session.
Resistance 1: From $ 17.25 (October 20 maximum)
Resistance 2: From $ 17.42 (October 16 maximum)
Support 1: From $ 16.73 (November 3 minimum)
Support 2: From $ 16.56 (October 27 minimum)
Computer analysis: The Stochastic Oscilliator movings on the D1 chart are also in the neutral zone, so the situation can be similar to gold.