
Тechnical analysis of currency pairs (Anton Hanzenko)
EUR USD (current price: 1.2340)

- Support levels: 1.2100 (September 2017 maximum), 1.1900, 1.1700.
- Resistance levels: 1.2600, 1.2750 (March 2013 minimum), 1.2270 (November 2014 minimum).
- Computer analysis: MACD (12,26,9) (signal-upward movement): the indicator is below 0, the signal line has left the body of the histogram. RSI (14) in the neutral zone. IchimokuKinkoHyo (9,26,52) (signal – upward movement, flat): the Tenkan-sen line above the Kijun-sen line, the price is higher than the cloud.
- The main recommendation: sale entry is started from 1.2360, 1.2380, 1.2420.
- Alternative recommendation: buy entry is started from 1.2300, 1.2270, 1.2240.
The euro dollar remains in the correction phase on the weakness of the American dollar, while it is limited to last week’s highs of 1.2400-1.2420.
GBP USD (current price: 1.3870)
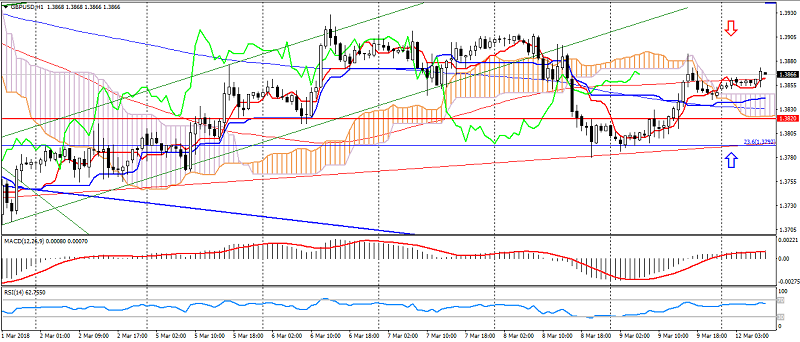
- Support levels: 1.3820,1.3650 (September 2017 maximum), 1.3450.
- Resistance levels: 1.4050, 1.4350, 1.4500.
- Computer analysis: MACD (12,26,9) (signal – upward movement): indicator above 0, signal line in the body of the histogram. RSI (14) in the overbought zone. IchimokuKinkoHyo (9,26,52) (signal – upward movement): the Tenkan-sen line above the Kijun-sen line, the price is higher than the cloud.
- The main recommendation: sale entry is started from 1.3900, 1.3930, 1.3950.
- Alternative recommendation: buy entry is started from 1.350, 1.3820, 1.3800.
The British pound is also corrected for the weakness of the American dollar, but is still limited to recent highs.
USD CHF (current price: 0.9490)
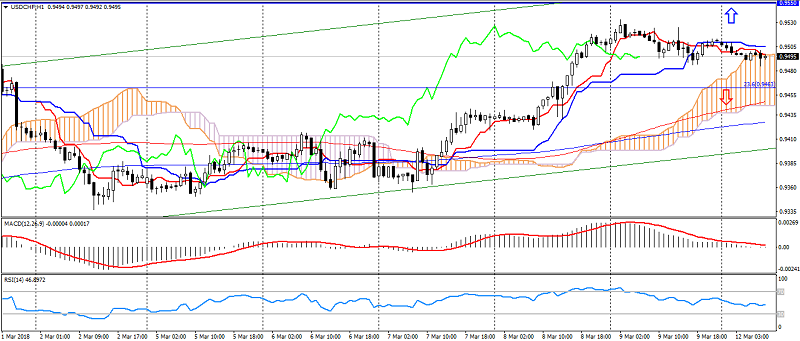
- Support levels: 0.9250 (August 2015 minimum), 0.9150, 0.9050 (May 2015 minimum).
- Resistance levels:, 0.9550, 0.9800, 1.0030 (November 2017 high).
- Computer analysis: MACD (12,26,9) (signal – downward movement): the indicator is higher than 0, the signal line has left the body of the histogram. RSI (14) in the neutral zone. IchimokuKinkoHyo (9,26,52) (signal – downward movement, flat): the Tenkan-sen line below the line Kijun-sen, the price in the cloud.
- The main recommendation: sale entry is started from 0.9530, 0.9550, 0.9580.
- Alternative recommendation: buy entry is started from 0.9450, 0.9430, 0.9400.
The Swiss franc strengthened early in the day, but is limited to an uptrend in the pair.
USD JPY (current price: 106.60)
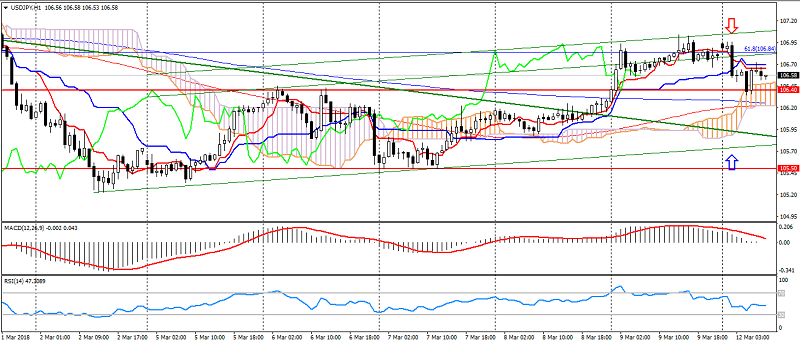
- Support levels: 106.40, 105.50, 104.50.
- Levels of resistance: 108.00, 108.60, 110.00.
- Computer analysis: MACD (12, 26, 9) (signal – downward movement): the indicator is above 0, the signal line has left the body of the histogram. RSI (14) in the neutral zone. IchimokuKinkoHyo (9,26,52) (signal-upward movement): the Tenkan-sen line is below the Kijun-sen line, the price is higher than the cloud.
- The main recommendation: sale entry is started from 107.00, 107.20, 107.40.
- Alternative recommendation: buy entry is started from 106.40, 106.20, 106.00.
The Japanese yen appreciably strengthened on the restrained trading on Monday, while the pair is limited to an uptrend.
USD CAD (current price: 1.2810)
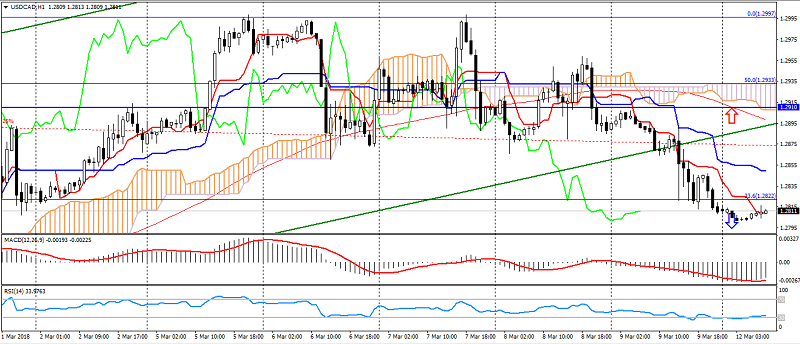
- Support levels: 1.2730,1.2600, 1.2500.
- Resistance levels: 1.2910 (November 2017 high), 1.3030, 1.3150.
- Computer analysis: MACD (12, 26, 9) (signal – upward movement): the indicator is below 0, the signal line has left the body of the histogram. RSI (14) in the oversold zone. IchimokuKinkoHyo (9,26,52) (signal – downward movement): the Tenkan-sen line is below the Kijun-sen line, the price is below the cloud.
- The main recommendation: sale entry is started from 1.2850, 1.2880, 1.2910.
- Alternative recommendation: buy entry is started from 1.2800, 1.2780, 1.2750.
The Canadian dollar remains optimistic on the data that the US wouldn’t impose import duties on Canada steel thereby breaking the uptrend in the pair, but in conditions of oversold correction is possible .
AUD USD (current price: 0.7870)
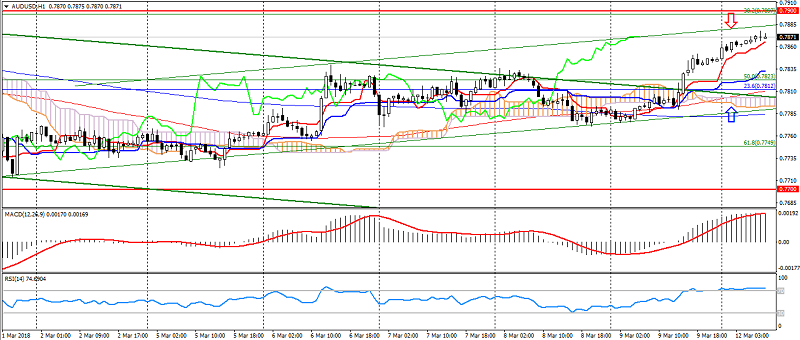
- Support levels: 0.7900, 0.7700 (March 2017 maximum), 0.7500.
- Resistance levels: 0.8120 (2017 maximum), 0.8200, 0.8290 (2014 maximum).
- Computer analysis: MACD (12, 26, 9) (signal – upward movement): indicator above 0, signal line in the body of the histogram. RSI (14) in the overbought zone. IchimokuKinkoHyo (9,26,52) (signal – upward movement): the Tenkan-sen line above the Kijun-sen line, the price is higher than the cloud.
- The main recommendation: sale entry is started from 0.7880, 0.7900, 0.7920.
- Alternative recommendation: buy entry is started from 0.7850, 0.7830, 0.7800.
The Australian dollar also strengthened on the growth of optimism and the breaking of the downtrend, limiting itself to overbought.
NZD USD (current price: 0.7310)
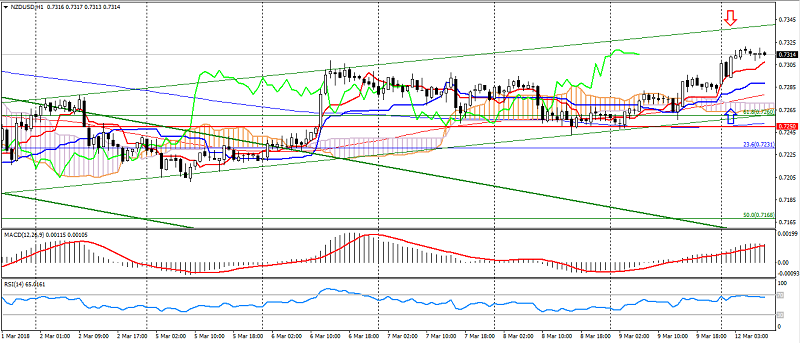
- Support levels: 0.7250, 0.7130 (the minimum of August 2017), 0.7000.
- Resistance levels: 0.7380, 0.7450, 0.7550 (maximum of 2017).
- Computer analysis: MACD (12, 26, 9) (signal-upward movement): the indicator is above 0, the signal line in the body of the histogram. RSI (14) in the neutral zone. IchimokuKinkoHyo (9,26,52) (signal – upward movement): the Tenkan-sen line above the Kijun-sen line, the price is higher than the cloud.
- The main recommendation: sale entry is started from 0.7340, 0.7360, 0.7380.
- Alternative recommendation: buy entry is started from 0.7280, 0.7260, 0.7240.
The New Zealand dollar remains optimistic on the weakness of the American dollar, while limiting itself to overbought.
XAU USD (current price: 1322.00)
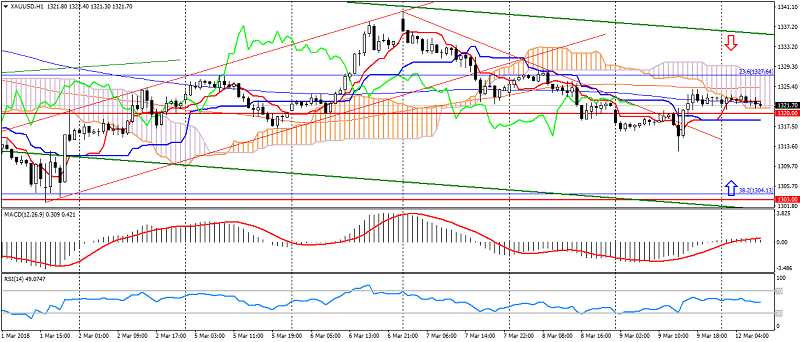
- Support levels: 1320.00, 1303.00, 1280.00.
- Resistance levels: 1355.00 (May May 2016 maximum), 1374.00, 1290.00 (March 2016 maximum).
- Computer analysis: MACD (12, 26, 9) (signal – downward movement): the indicator is above 0, the signal line has left the body of the histogram. RSI (14) in the neutral zone. IchimokuKinkoHyo (9,26,52) (signal – upward movement, flat): the Tenkan-sen line above the Kijun-sen line, the price in the cloud.
- The main recommendation: sale entry is started from 1325.00, 1330.00, 1334.00.
- Alternative recommendation: buy entry is started from 1313.00, 1309.00, 1303.00.
Gold remains clamped in the sideways trend due to market uncertainty.