
Тechnical analysis of currency pairs (Anton Hanzenko)
EUR USD (current price: 1.2310)
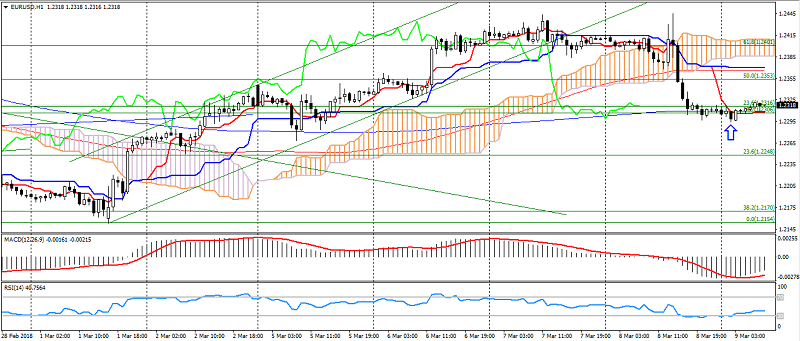
- Support levels: 1.2100 (September-September maximum), 1.1900, 1.1700.
- Resistance levels: 1.2600, 1.2750 (March 2013 minimum), 1.2270 (November 2014 minimum).
- Computer analysis: MACD (12,26,9) (signal-upward movement): the indicator is below 0, the signal line has left the body of the histogram. RSI (14) is in the neutral zone. IchimokuKinkoHyo (9,26,52) (signal – downward movement): the Tenkan-sen line is below the Kijun-sen line, the price is below the cloud.
- The main recommendation: sale entry is started from 1.2350, 1.2380, 1.2400.
- Alternative recommendation: buy entry is started from 1.2300, 1.2270, 1.2240.
The euro dollar remains under the pressure of the comments of the ECB head, but still retains the potential for correction.
GBP USD (current price: 1.3820)
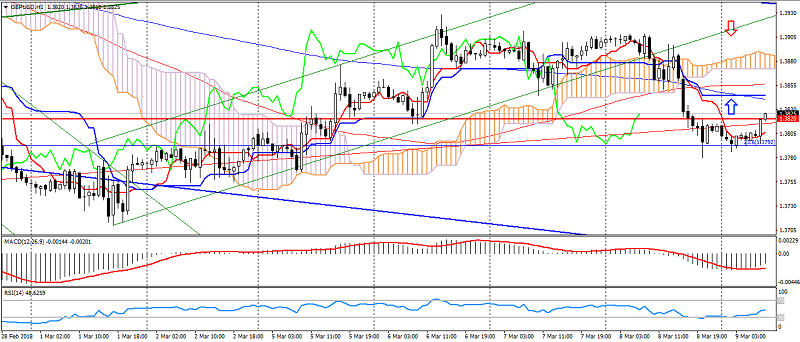
- Support levels: 1.3820,1.3650 (September 2017 maximum), 1.3450.
- Resistance levels: 1.4050, 1.4350, 1.4500.
- Computer analysis: MACD (12,26,9) (signal – upward movement): the indicator is below 0, the signal line is in the body of the histogram. RSI (14) is in the neutral zone. IchimokuKinkoHyo (9,26,52) (signal – downward movement): the line Tenkan-sen is below the line Kijun-sen, the price is in the cloud.
- The main recommendation: sale entry is started from 1.3850, 1.3880, 1.3900.
- Alternative recommendation: buy entry is started from 1.3800, 1.3780, 1.3750.
The British pound is also adjusted after the decline, while the significant growth of the British may be limited.
USD CHF (current price: 0.9520)
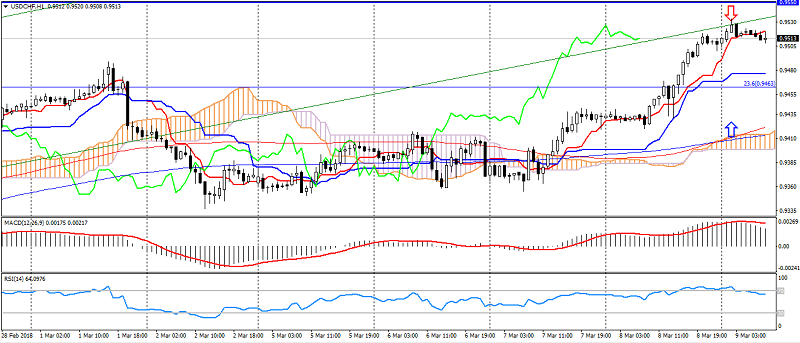
- Support levels: 0.9250 (August 2015 minimum), 0.9150, 0.9050 (May 2015 minimum).
- Resistance levels: 0.9550, 0.9800, 1.0030 (November 2017 maximum).
- Computer analysis: MACD (12,26,9) (signal – downward movement): the indicator is higher than 0, the signal line has left the body of the histogram. RSI (14) is in the overbought zone. IchimokuKinkoHyo (9,26,52) (signal – upward movement): the Tenkan-sen line is above the Kijun-sen line, the price is higher than the cloud.
- The main recommendation: sale entry is started from 0.9530, 0.9550, 0.9580.
- Alternative recommendation: buy entry is started from 0.9480, 0.9450, 0.9430.
The Swiss franc remains under pressure, but is limited to oversold.
USD JPY (current price: 106.70)
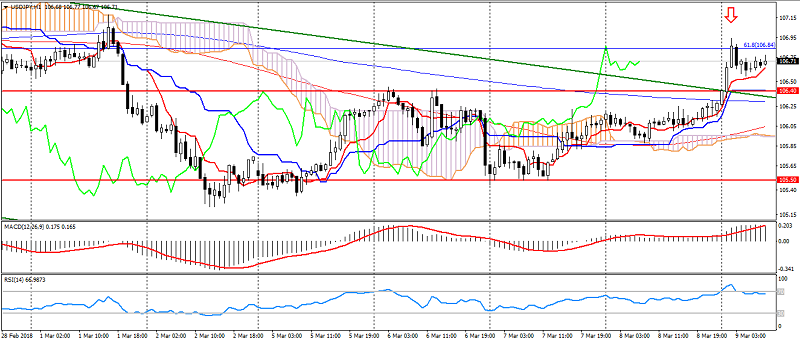
- Support levels: 106.40, 105.50, 104.50.
- Levels of resistance: 108.00, 108.60, 110.00.
- Computer analysis: MACD (12, 26, 9) (signal – upward movement): the indicator is above 0, the signal line is in the body of the histogram. RSI (14) is in the overbought zone. IchimokuKinkoHyo (9,26,52) (signal- downward movement): the Tenkan-sen line is above the Kijun-sen line, the price is higher than the cloud.
- The main recommendation: sale entry is started from 107.00, 107.20, 107.40.
- Alternative recommendation: buy entry is started from 106.50, 106.20, 106.00.
The Japanese yen remains under pressure of the recovery of optimism. At the same time, the pair withdrew from the established trend, which may indicate the formation of a flat.
USD CAD (current price: 1.2870)
- Support levels: 1.2730,1.2600, 1.2500.
- Resistance levels: 1.2910 (November 2017 maximum), 1.3030, 1.3150.
- Computer analysis: MACD (12, 26, 9) (signal – downward movement): the indicator is below 0, the signal line is in the body of the histogram. RSI (14) is in the oversold zone. IchimokuKinkoHyo (9,26,52) (signal – downward movement): the Tenkan-sen line is below the Kijun-sen line, the price is below the cloud.
- The main recommendation: sale entry is started from 1.2910, 1.2950, 1.2970.
- Alternative recommendation: buy entry is started from 1.2850, 1.2830, 1.2800.
The Canadian dollar remains optimistic on data that the US will not impose a duty on steel imports from Canada. In this case, the pair remains oversold and limited to an uptrend.
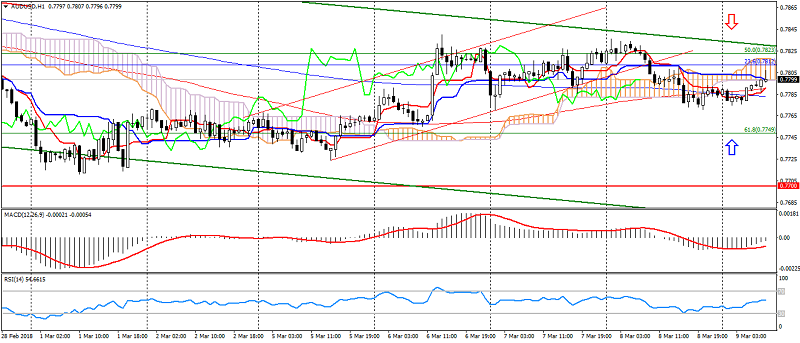
AUD USD (current price: 0.7800)
- Support levels: 0.7900, 0.7700 (March 2017 maximum), 0.7500.
- Resistance levels: 0.8120 (2017 maximum), 0.8200, 0.8290 (2014 maximum).
- Computer analysis: MACD (12, 26, 9) (signal – upward movement): the indicator is below 0, the signal line has left the body of the histogram. RSI (14) is in the neutral zone. IchimokuKinkoHyo (9,26,52) (signal – downward movement): the Tenkan-sen line is below the Kijun-sen line, the price is below the cloud.
- The main recommendation: salee entry is started from 0.7820, 0.7840, 0.7870.
- Alternative recommendation: buy entry is started from 0.7760, 0.7740, 0.7700.
The Australian also has strengthened on growth of optimism, but still it is limited to a downward trend.
NZD USD (current price: 0.7270)
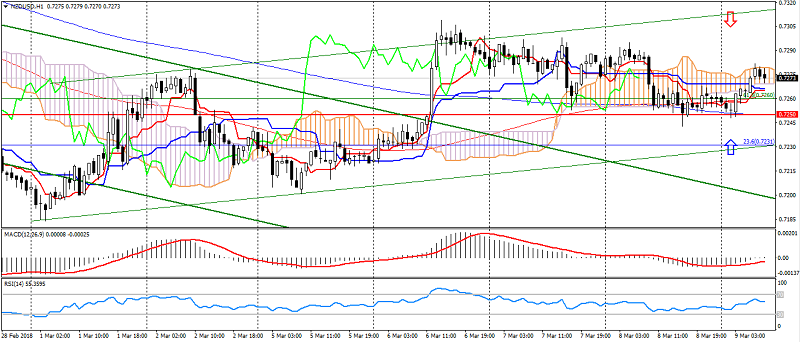
- Support levels: 0.7250, 0.7130 ( August 2017 minimum), 0.7000.
- Resistance levels: 0.7380, 0.7450, 0.7550 (2017 maximum).
- Computer analysis: MACD (12, 26, 9) (signal-upward movement): the indicator is below 0, the signal line has left the body of the histogram. RSI (14) is in the neutral zone. IchimokuKinkoHyo (9,26,52) (flat signal): the Tenkan-sen line is near the Kijun-sen line, the price is in the cloud.
- The main recommendation: sale entry is started from 0.7290, 0.7320, 0.7350.
- Alternative recommendation: buy entry is started from 0.7250, 0.7230, 0.7200.
The New Zealand dollar is limited to a lateral trend, preserving the potential for strengthening.
XAU USD (current price: 1318.00)
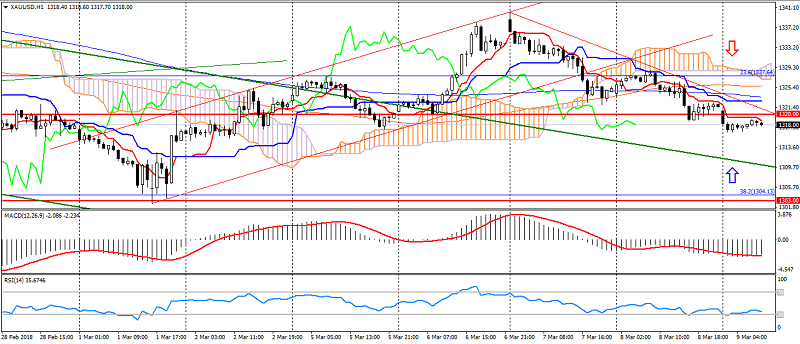
- Support levels: 1320.00, 1303.00, 1280.00.
- Resistance levels: 1355.00 (May 2016 maximum), 1374.00, 1290.00 (March 2016 maximum).
- Computer analysis: MACD (12, 26, 9) (signal – downward movement): the indicator is below 0, the signal line has left the body of the histogram. RSI (14) is in the neutral zone. IchimokuKinkoHyo (9,26,52) (signal- downward movement): the Tenkan-sen line is below the Kijun-sen line, the price is below the cloud.
- The main recommendation: sale entry is started from 1325.00, 1330.00, 1334.00.
- Alternative recommendation: buy entry is started from 1313.00, 1309.00, 1303.00.
Gold was under pressure of the resumption of optimism, but the decline is also limited by the formation of a lateral trend.