
Тechnical analysis of currency pairs (Anton Hanzenko)
EUR USD (current price: 1.2370)

- Support levels: 1.2100 (September 2017 maximum), 1.1900, 1.1700.
- Resistance levels: 1.2600, 1.2750 (March 2013 minimum), 1.2270 (November 2014 minimum).
- Computer analysis: MACD (12,26,9) (signal-upward movement): the indicator is above 0, the signal line is in the body of the histogram. RSI (14) is in the neutral zone. IchimokuKinkoHyo (9,26,52) (signal – upward movement): the Tenkan-sen line is above the Kijun-sen line, the price is higher than the cloud.
- The main recommendation: sale entry is started from 1.2400, 1.2420, 1.2450.
- Alternative recommendation: buy entry is started from 1.2350, 1.2320, 1.2300.
The euro is traded in an upward trend on the general weakness of the American, before the publication of the report on inflation in the US. In this case, the pair remains in overbought, which limits growth and can cause correction.
GBP USD (current price: 1.3890)
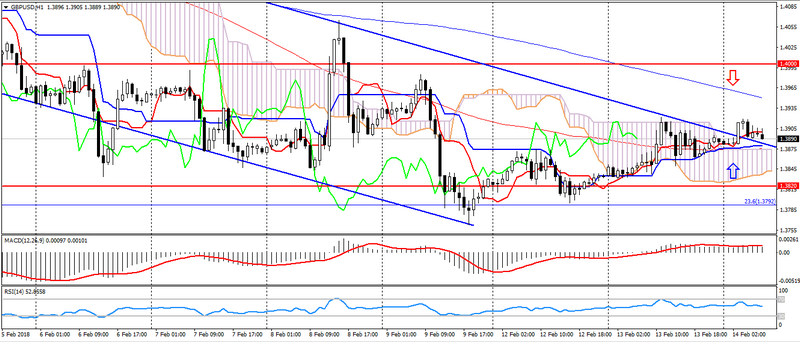
- Support levels: 1.4000 (April 2016 minimum), 1.3820, 1.3650 (September 2017 maximum).
- Resistance levels: 1.4350, 1.4500, 1.4750 (May May 2016 maximum).
- Computer analysis: MACD (12,26,9) (signal – upward movement): the indicator is above 0, the signal line is in the body of the histogram. RSI (14) is in the neutral zone. IchimokuKinkoHyo (9,26,52) (signal – upward movement, flat): the Tenkan-sen line is above the Kijun-sen line, the price is below the cloud.
- The main recommendation: sale entry is started from 1.3920, 1.3960, 1.4000.
- Alternative recommendation: buy entry is started from 1.3860, 1.3820, 1.3800.
The British pound slowed its decline from the level of 1.3820-00, but still remains under pressure, which could cause the pair to return to a downtrend.
USD CHF (current price: 0.9340)
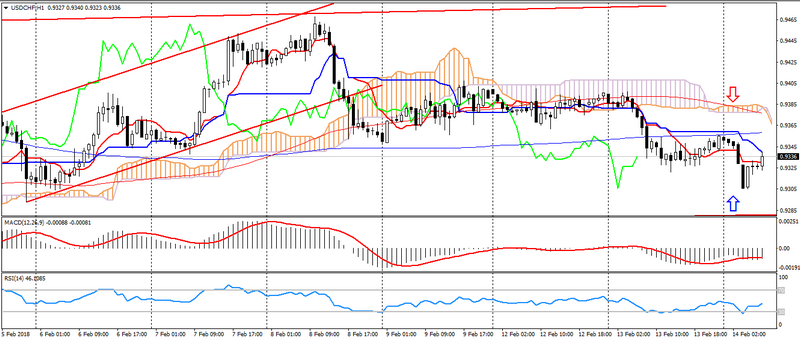
- Support levels: 0.9250 (August 2015 minimum), 0.9150, 0.9050 (May 2015 minimum).
- Resistance levels:, 0.9550, 0.9800, 1.0030 (November 2017 maximum).
- Computer analysis: MACD (12,26,9) (signal – downward movement): the indicator is below 0, the signal line is in the body of the histogram. RSI (14) is in the neutral zone. IchimokuKinkoHyo (9,26,52) (signal – downward movement): the Tenkan-sen line is below the Kijun-sen line, the price is below the cloud.
- The main recommendation: sale entry is started from 0.9360, 0.9390, 0.9420.
- Alternative recommendation: buy entry is started from 0.9320, 0.9300, 0.9280.
The Swiss franc appreciably strengthened earlier in the day on flight from risks, but with the growth of stock indices moved into the correction phase.
USD JPY (current price: 107.40)
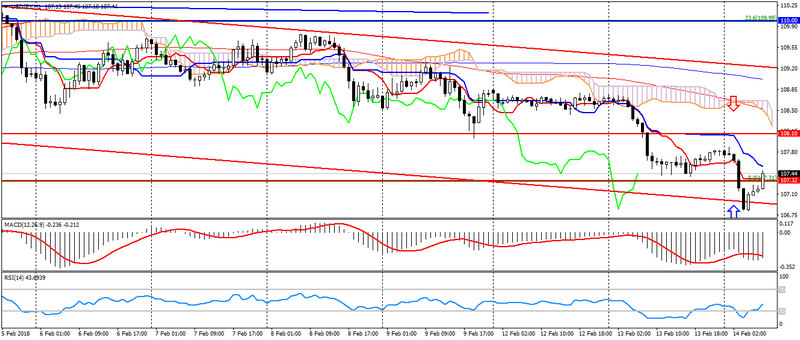
- Support levels: 108.10 (April 2017 minimum), 107.30 (2017 minimum), 106.40.
- Resistance levels: 110.00, 110.80, 111.70 (October 2017 minimum).
- Computer analysis: MACD (12, 26, 9) (signal – downward movement): the indicator is below 0, the signal line is in the body of the histogram. RSI (14) is in the neutral zone. IchimokuKinkoHyo (9,26,52) (signal- downward movement): the Tenkan-sen line is below the Kijun-sen line, the price is below the cloud.
- The main recommendation: sale entry is started from 107.80, 108.10, 108.50.
- Alternative recommendation: buy entry is started from 107.10, 106.80, 106.50.
The Japanese yen also turned out to be under pressure of correction after a break from the level of 106.80-90, which was caused by the resumption of the growth of stock exchanges. Also, for this pair, formation of bullish divergence can be traced, which may indicate a deeper correction.
USD CAD (current price: 1.2580)
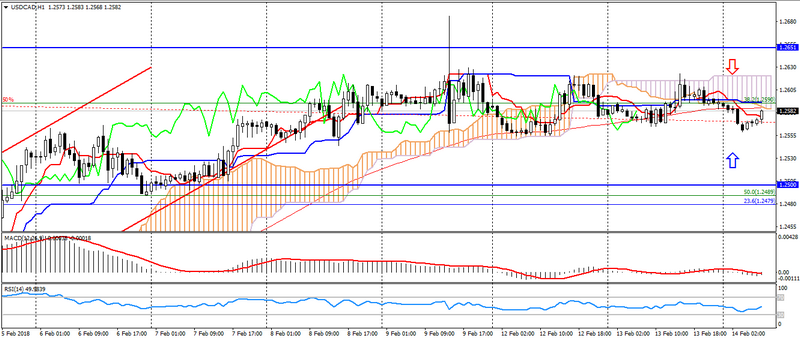
- Support levels: 1.2340.1.2200, 1.2060 (2017 minimum).
- Resistance levels: 1.2500, 1.2650, 1.2770 (August 2017 maximum).
- Computer analysis: MACD (12, 26, 9) (signal-flat): the indicator is near 0. RSI (14) is in the neutral zone. IchimokuKinkoHyo (9,26,52) (signal – downward movement): the Tenkan-sen line is below the Kijun-sen line, the price is below the cloud.
- The main recommendation: sale entry is started from 1.2600, 1.2620, 1.2650.
- Alternative recommendation: buy entry is started from 1.2550, 1.2530, 1.2500.
The Canadian dollar maintains a moderate dynamics, despite the weakness of the American.
AUD USD (current price: 0.7870)
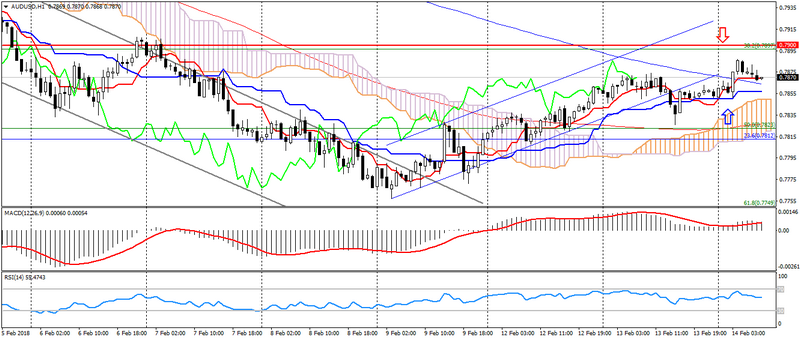
- Support levels: 0.7900, 0.7700 (March 2017 maximum), 0.7500.
- Resistance levels: 0.8120 (2017 maximum), 0.8200, 0.8290 (2014 maximum).
- Computer analysis: MACD (12, 26, 9) (signal – upward movement): the indicator is above 0, the signal line is in the body of the histogram. RSI (14) is in the neutral zone. IchimokuKinkoHyo (9,26,52) (signal – upward movement): the Tenkan-sen line is above the Kijun-sen line, the price is higher than the cloud.
- The main recommendation: sale entry is started from 0.7900, 0.7920, 0.7940.
- Alternative recommendation: buy entry is started from 0.7850, 0.7830, 0.7800.
The Australian also strengthened earlier in the day, but it slowed the uptrend, which indicates the formation of a sideways trend.
NZD USD (current price: 0.7300)
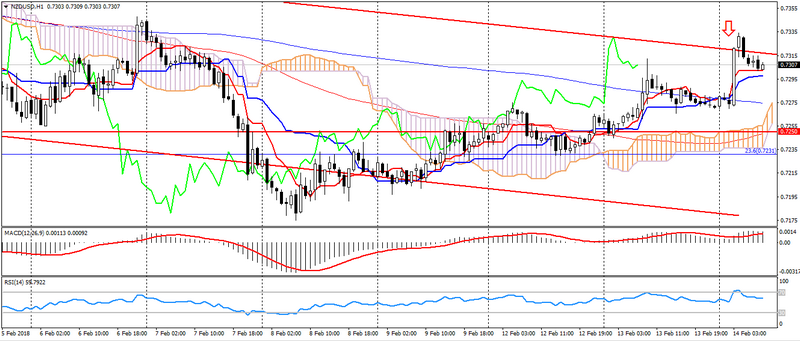
- Support levels: 0.7250, 0.7130 (August 2017 minimum), 0.7000.
- Resistance levels: 0.7380, 0.7450, 0.7550 (2017 maximum).
- Computer analysis: MACD (12, 26, 9) (signal-upward movement): the indicator is above 0, the signal line is in the body of the histogram. RSI (14) is in the neutral zone. IchimokuKinkoHyo (9,26,52) (signal – upward movement): the Tenkan-sen line is above the Kijun-sen line, the price is higher than the cloud.
- The main recommendation: sale entry is started from 0.7330, 0.7350, 0.7380.
- Alternative recommendation: buy entry is started from 0.7270, 0.7250, 0.7230.
The New Zealand dollar gained support at the beginning of the day on data on inflation growth, but in the conditions of a downtrend further growth of the pair remains limited.
XAU USD (current price: 1332.00)
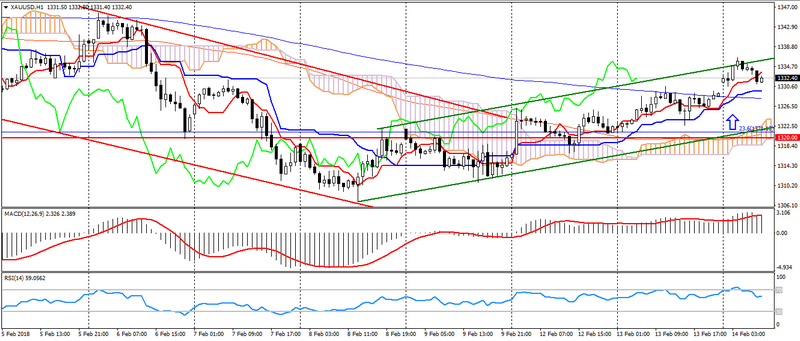
- Support levels: 1320.00, 1303.00, 1280.00.
- Resistance levels: 1355.00 (May 2016 maximum), 1374.00, 1290.00 (March 2016 maximum).
- Computer analysis: MACD (12, 26, 9) (signal – upward movement): the indicator is above 0, the signal line is in the body of the histogram. RSI (14) is in the neutral zone. IchimokuKinkoHyo (9,26,52) (signal- upward movement): the Tenkan-sen line is above the Kijun-sen line, the price is higher than the cloud.
- The main recommendation: sale entry is started from 1340.00, 1345.00, 1350.00.
- Alternative recommendation: buy entry is started from 1327.00, 1323.00, 1320.00.
Gold remains in an upward trend, while limiting itself to overbought, which can cause a correction.