
Тechnical analysis of currency pairs (Anton Hanzenko)
EUR USD (current price: 1.2310)

- Support levels: 1.2100 (September 2017 maximum), 1.1900, 1.1700.
- Resistance levels: 1.2600, 1.2750 (March 2013 minimum), 1.2270 (November 2014 minimum).
- Computer analysis: MACD (12,26,9) (signal-upward movement): the indicator is above 0, the signal line is in the body of the histogram. RSI (14) is in the neutral zone. IchimokuKinkoHyo (9,26,52) (signal – upward movement): the Tenkan-sen line is above the Kijun-sen line, the price is higher than the cloud.
- The main recommendation: sale entry is started from 1.2350, 1.2380, 1.2420.
- Alternative recommendation: buy entry is started from 1.2280, 1.2250, 1.2230.
The euro dollar pair accelerated growth on the positive opening of Asian stock exchanges, but slowed at the ambiguous opening of Europe. As a result, some uncertainty associated with risks remains on the market. At the same time, an upward trend in the pair is maintained due to the correction of the American.
GBP USD (current price: 1.3860)
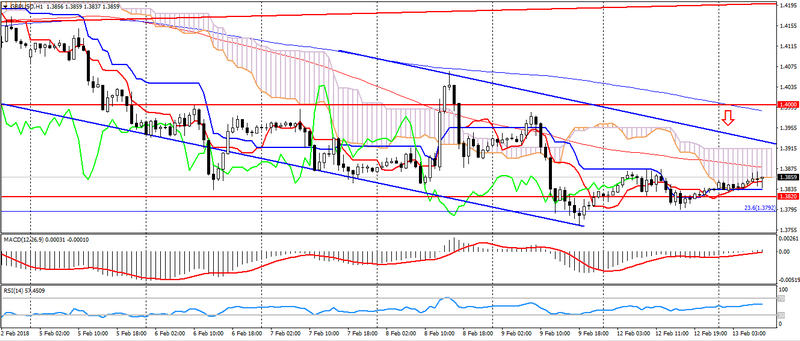
- Support levels: 1.4000 (April 2016 minimum), 1.3820, 1.3650 (September 2017 maximum).
- Resistance levels: 1.4350, 1.4500, 1.4750 (May May 2016 maximum).
- Computer analysis: MACD (12,26,9) (signal – upward movement): the indicator is above 0, the signal line is in the body of the histogram. RSI (14) is in the neutral zone. IchimokuKinkoHyo (9,26,52) (signal – upward movement, flat): the Tenkan-sen line is above the Kijun-sen line, the price is below the cloud.
- The main recommendation: sale entry is started from 1.3890, 1.3920, 1.3950.
- Alternative recommendation: buy entry is started from 1.3800, 1.3760, 1.3730.
The British pound keeps a downward trend, limiting itself to the lows of last week, despite attempts at correction.
USD CHF (current price: 0.9340)
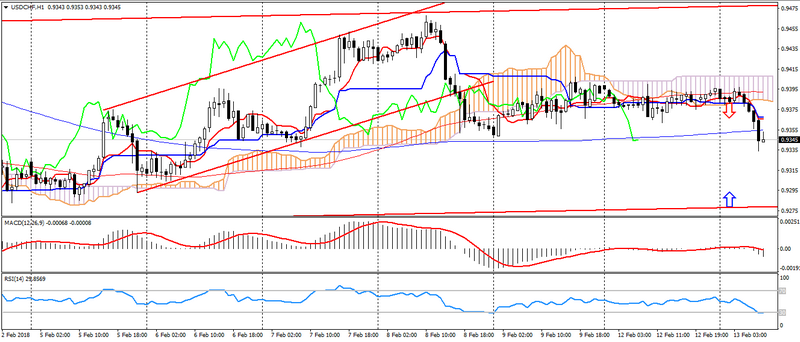
- Support levels: 0.9250 (August 2015 minimum), 0.9150, 0.9050 (May 2015 minimum).
- Resistance levels:, 0.9550, 0.9800, 1.0030 (November 2017 maximum).
- Computer analysis: MACD (12,26,9) (signal – downward movement): the indicator is below 0, the signal line is in the body of the histogram. RSI (14) is in the oversold zone. IchimokuKinkoHyo (9,26,52) (signal – downward movement): the Tenkan-sen line is below the Kijun-sen line, the price is below the cloud.
- The main recommendation: sale entry is started from 0.9360, 0.9390, 0.9420.
- Alternative recommendation: buy entry is started from 0.9320, 0.9290, 0.9270.
The Swiss franc accelerated growth on the weakness of the American and the preservation of risks, which may indicate the possibility of renewed demand for safe haven assets.
USD JPY (current price: 107.50)
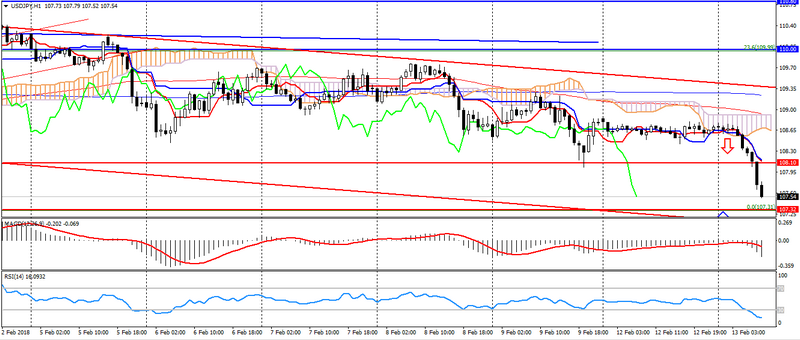
- Support levels: 108.10 (April 2017 minimum), 107.30 (2017 minimum), 106.40.
- Resistance levels: 110.00, 110.80, 111.70 (October 2017 minimum).
- Computer analysis: MACD (12, 26, 9) (signal – downward movement): the indicator is below 0, the signal line is in the body of the histogram. RSI (14) is in the oversold zone. IchimokuKinkoHyo (9,26,52) (signal- downward movement): the Tenkan-sen line is below the Kijun-sen line, the price is below the cloud.
- The main recommendation: sale entry is started from 108.10, 108.60, 109.00.
- Alternative recommendation: buy entry is started from 107.30, 107.10, 106.80.
The Japanese yen also accelerated growth on the resumption of risks and weakness of the American, while the pair continues to be limited to last year’s minimums at around 107.30-00.
USD CAD (current price: 1.2570)
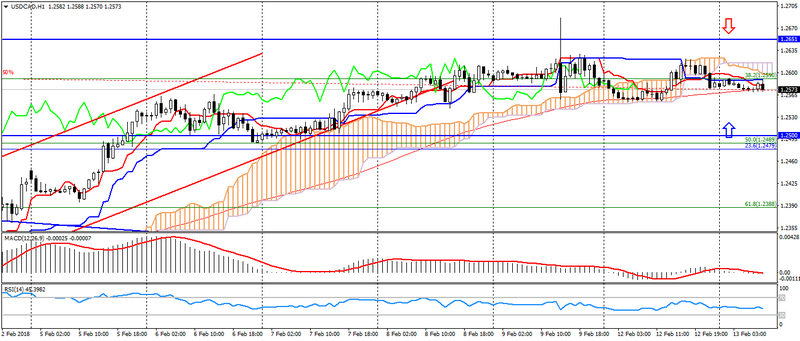
- Support levels: 1.2340.1.2200, 1.2060 (2017 minimum).
- Resistance levels: 1.2500, 1.2650, 1.2770 (August 2017 maximum).
- Computer analysis: MACD (12, 26, 9) (signal-flat): the indicator is near 0. RSI (14) is in the neutral zone. IchimokuKinkoHyo (9,26,52) (signal – downward movement): the Tenkan-sen line is below the Kijun-sen line, the price is below the cloud.
- The main recommendation: sale entry is started from 1.2600, 1.2620, 1.2650.
- Alternative recommendation: buy entry is started from 1.2550, 1.2530, 1.2500.
The Canadian dollar maintains a restrained dynamic, despite the weakness of the American, limited to weak data on employment in Canada, which came out last week.
AUD USD (current price: 0.7860)
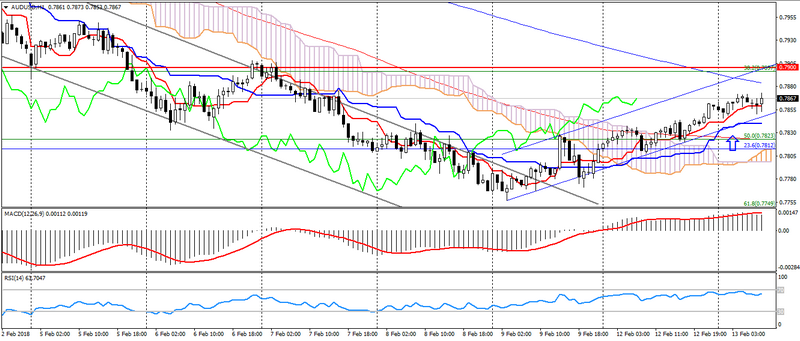
- Support levels: 0.7900, 0.7700 (March 2017 maximum), 0.7500.
- Resistance levels: 0.8120 (2017 maximum), 0.8200, 0.8290 (2014 maximum).
- Computer analysis: MACD (12, 26, 9) (signal – downward movement): the indicator is above 0, the signal line has left the body of the histogram. RSI (14) is in the neutral zone. IchimokuKinkoHyo (9,26,52) (signal – upward movement): the Tenkan-sen line is above the Kijun-sen line, the price is higher than the cloud.
- The main recommendation: sale entry is started from 0.7880, 0.7900, 0.7930.
- Alternative recommendation: buy entry is started from 0.7840, 0.7810, 0.7790.
The Australian has broken the downward momentum, but is limited by the remaining risks.
NZD USD (current price: 0.7290)
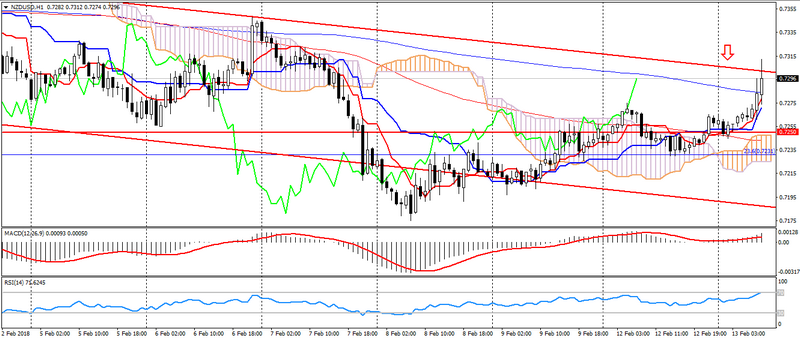
- Support levels: 0.7250, 0.7130 (August 2017 minimum), 0.7000.
- Resistance levels: 0.7380, 0.7450, 0.7550 (2017 maximum).
- Computer analysis: MACD (12, 26, 9) (signal-upward movement): the indicator is above 0, the signal line is in the body of the histogram. RSI (14) is in the overbought zone. IchimokuKinkoHyo (9,26,52) (signal – upward movement): the Tenkan-sen line is above the Kijun-sen line, the price is higher than the cloud.
- The main recommendation: sale entry is from 0.7300, 0.7330, 0.7350.
- Alternative recommendation: buy entry is started from 0.7270, 0.7250, 0.7230.
The New Zealand dollar also gained support at the beginning of the day, but, in a downtrend, the further growth of the pair will be limited to the zone of 0.7300-20.
XAU USD (current price: 1328.00)
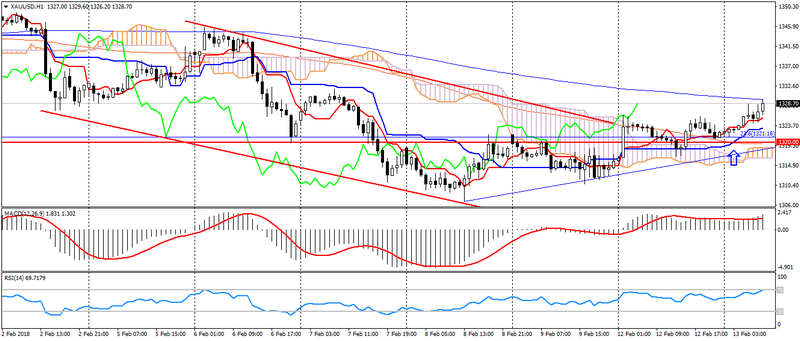
- Support levels: 1320.00, 1303.00, 1280.00.
- Resistance levels: 1355.00 (May May 2016 maximum), 1374.00, 1290.00 (March 2016 maximum).
- Computer analysis: MACD (12, 26, 9) (signal – upward movement): the indicator is above 0, the signal line is in the body of the histogram. RSI (14) is in the overbought zone. IchimokuKinkoHyo (9,26,52) (signal- upward movement): the Tenkan-sen line is above the Kijun-sen line, the price is higher than the cloud.
- The main recommendation: sale entry is started from 1332.00, 1336.00, 1344.00.
- Alternative recommendation: buy entry is started from 1323.00, 1300.00, 1314.00.
Gold came out from a downtrend on the formation of a reversal from the level of 1320.00-1300.00. The pair is limited to a small overbought.