
Тechnical analysis of currency pairs (Anton Hanzenko)
EUR USD (current price: 1.2500)

- Support levels: 1.2100 (September 2017, maximum), 1.1900, 1.1700.
- Resistance levels: 1.2600, 1.2750 (March 2013 minimum), 1.2270 (November 2014 minimum).
- Computer analysis: MACD (12,26,9) (signal- downward movement): the indicator is above 0, the signal line has left the histogram bar. RSI (14) is in the neutral zone. IchimokuKinkoHyo (9,26,52) (signal – upward movement): the Tenkan-sen line is above the Kijun-sen line, the price is higher than the cloud.
- The main recommendation: sale entry is started from 1.2420, 1.2450, 1.2480.
- Alternative recommendation: buy entry is started from 1.2370, 1.2350, 1.2330.
The pair is near the significant psychology 1.2500 after growth. At the same time, this pair is in a significant overbought due to the uptrend. The market has focused on employment data, which could have a significant impact on the future dynamics of the pair.
GBP USD (current price: 1.4250)
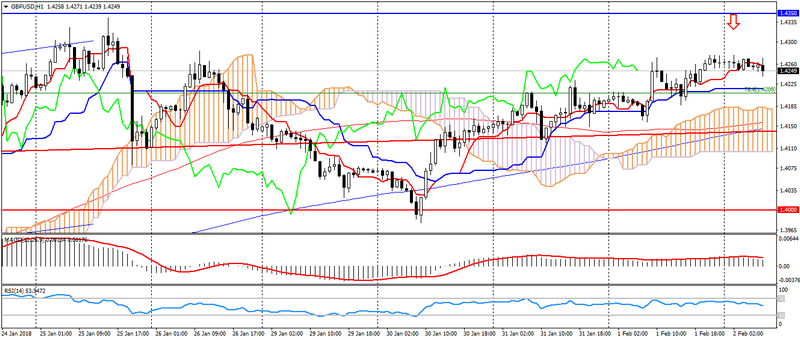
- Support levels: 1.4000 ( April 2016 minimum), 1.3820, 1.3650 (September 2017 maximum).
- Resistance levels: 1.43500, 1.4500, 1.4750 (May May 2016 maximum).
- Computer analysis: MACD (12,26,9) (signal – downward movement): the indicator is above 0, the signal line has left the histogram bar. RSI (14) is in the neutral zone. IchimokuKinkoHyo (9,26,52) (signal – upward movement): the Tenkan-sen line is above Kijun-sen, the price is higher than the cloud.
- The main recommendation: sale entry is started from 1.4210, 1.4250, 1.4280.
- Alternative recommendation: buy entry is started from 1.4130, 1.4100, 1.4070.
The British pound also remains in a significant overbought against the American, but is limited to the highs of January. This pair markedly accelerated its growth on the weakness of the dollar, limited to the level of 1.4350.
USD CHF (current price: 0.9260)
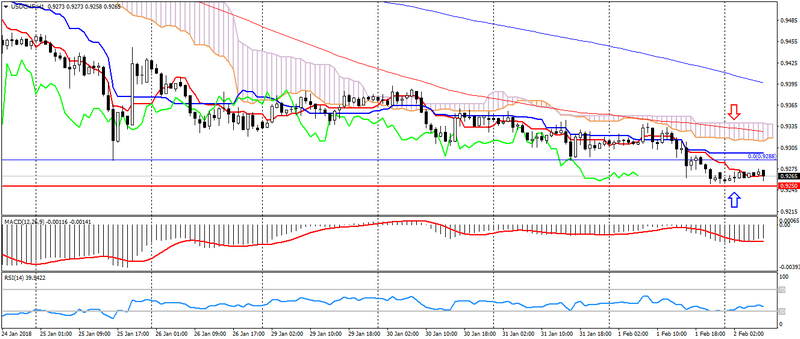
- Support levels: 0.9250 (August 2015 minimum), 0.9150, 0.9050 (May 2015 minimum).
- Resistance levels:, 0.9550, 0.9800, 1.0030 (November 2017 maximum).
- Computer analysis: MACD (12,26,9) (signal – upward movement): the indicator is below 0, the signal line has left the histogram bar. RSI (14) is in the neutral zone. IchimokuKinkoHyo (9,26,52) (signal – downward movement): the Tenkan-sen line is below the Kijun-sen line, the price is below the cloud.
- The main recommendation: sale entry is started from 0.9350, 0.9390, 0.9430.
- Alternative recommendation: buy entry is started from 0.9290, 0.9260, 0.9240.
The Swiss franc also accelerated growth on the weakness of the American. As a result, the pair renewed the three-year minimum. At the same time, 0.9250 support remains in force, despite the safety of the downward trend and the expectation of upcoming data on employment in the US.
USD JPY (current price: 109.70)
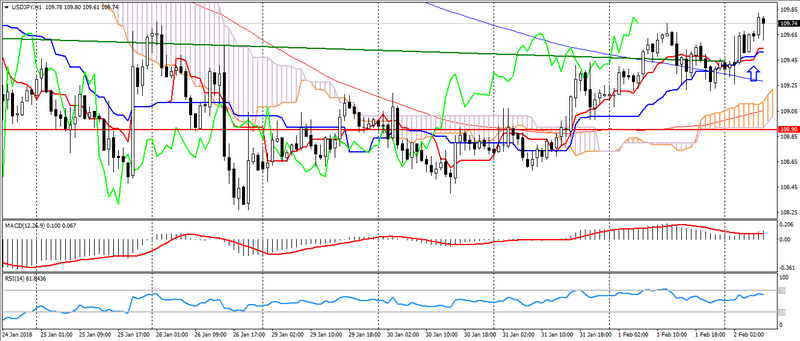
- Support levels: 108.90, 108.10 (April 2017 minimum), 107.30 ( 2017 minimum).
- Resistance levels: 110.80, 111.70 (October 2017 minimum), 113.70.
- Computer analysis: MACD (12, 26, 9) (signal – upward movement): the indicator is above 0, the signal line is in the body of the histogram. RSI (14) is in the neutral zone. IchimokuKinkoHyo (9,26,52) (signal- upward movement): the Tenkan-sen line is above the Kijun-sen line, the price is higher than the cloud.
- The main recommendation: sale entry is started from 109.70, 110.00, 110.20.
- Alternative recommendation: buy entry is started from 109.40, 109.00, 108.80.
The Japanese yen is under pressure because of the statement of the Bank of Japan, which announced its intention to buy state bonds. This caused a weakening of the yen across the entire spectrum of the market.
USD CAD (current price: 1.2270)
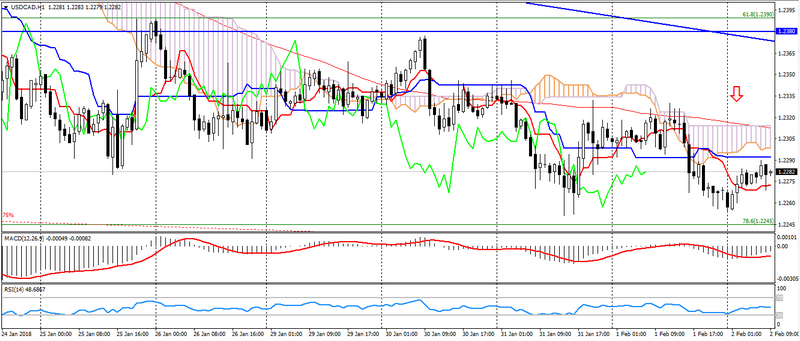
- Support levels: 1.2200, 1.2060 ( 2017 minimum), 1.1950 (2015 minimum).
- Resistance levels: 1.2380, 1.2500, 1.2650.
- Computer analysis: MACD (12, 26, 9) (signal – upward movement): the indicator is below 0, the signal line has left the body of the histogram. RSI (14) is in the neutral zone. IchimokuKinkoHyo (9,26,52) (signal – downward movement): the Tenkan-sen line is below the Kijun-sen line, the price is below the cloud.
- The main recommendation: sale entry is started from 1.2290, 1.2320, 1.2350.
- Alternative recommendation: buy entry is started from 1.2260, 1.2240, 1.2220.
The Canadian dollar receives support from the positive dynamics of raw materials and the weakness of the American, limited to a weekly minimum and oversold, and retaining the potential to strengthen due to a general downward trend in the pair.
AUD USD (current price: 0.8000)
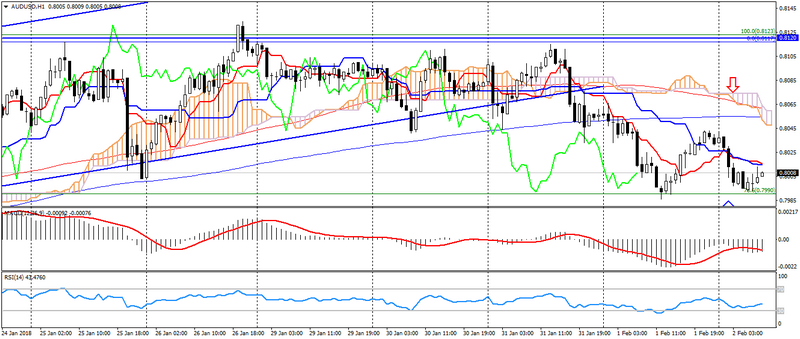
- Support levels: 0.7900, 0.7700 (March 2017 maximum), 0.7500.
- Resistance levels: 0.8120 (2017 maximum), 0.8200, 0.8290 (2014 maximum).
- Computer analysis: MACD (12, 26, 9) (signal – downward movement): the indicator is below 0, the signal line is in the body of the histogram. RSI (14) is in the neutral zone. IchimokuKinkoHyo (9,26,52) (signal – downward movement): the Tenkan-sen line is below the Kijun-sen line, the price is below the cloud.
- The main recommendation: sale entry is started from 0.8030, 0.8050, 0.8070.
- Alternative recommendation: buy entry is started from 0.7990, 0.7970, 0.7950.
The Australian is under pressure because of the weak data on construction in Australia, limited to the level of support 0.7980. At the same time, the uptrend in the pair slowed down due to repulsion from resistance 0.8120.
NZD USD (current price: 0.7370)
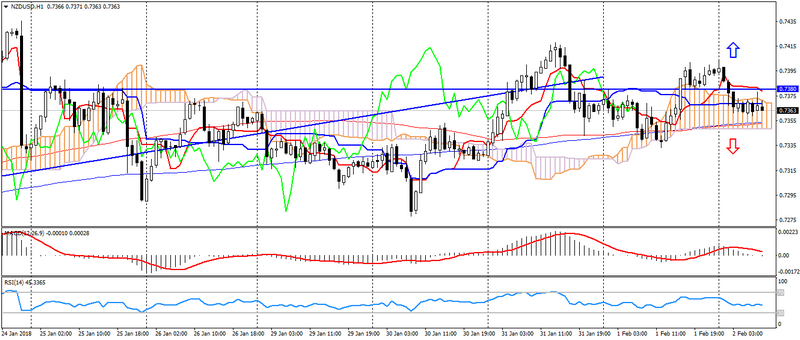
- Support levels: 0.7250, 0.7130 (August 2017 minimum), 0.7000.
- Resistance levels: 0.7380, 0.7450, 0.7550 (2017 maximum).
- Computer analysis: MACD (12, 26, 9) (signal- downward movement): the indicator is above 0, the signal line has left the body of the histogram. RSI (14) is in the neutral zone. IchimokuKinkoHyo (9,26,52) (signal – upward movement): the Tenkan-sen line is above the Kijun-sen line, the price is higher than the cloud.
- The main recommendation: sale entry is started from 0.7380, 0.7400, 0.7420.
- Alternative recommendation: buy entry is started from 0.7350, 0.7320, 0.7300.
The New Zealand dollar is traded with a slowdown in the sideways trend, with a level of 0.7380. But the general upward trend is in force.
XAU USD (current price: 1347.00)
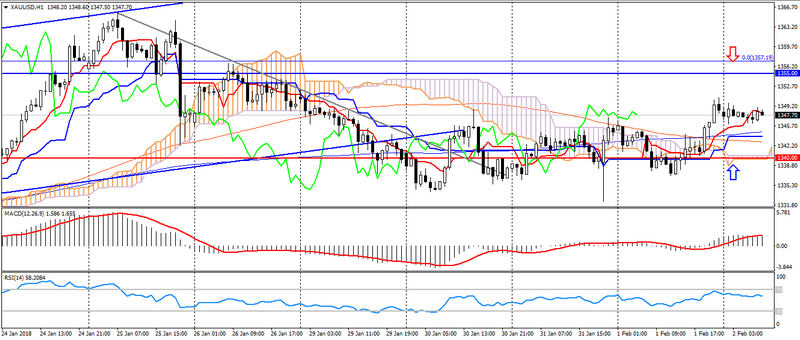
- Support levels: 1340.00, 1320.00, 1303.00.
- Resistance levels: 1355.00 (May May 2016 maximum), 1374.00, 1290.00 (March 2016 maximum).
- Computer analysis: MACD (12, 26, 9) (signal – upward movement): the indicator is above 0, the signal line is in the histogram. RSI (14) is in the neutral zone. IchimokuKinkoHyo (9,26,52) (signal – upward movement): the line Tenkan-sen is above the line Kijun-sen, the price is higher than the cloud.
- The main recommendation: sale entry is started from 1350.00, 1355.00, 1359.00.
- Alternative recommendation: buy entry is started from 1344.00, 1340.00, 1336.00.
Gold is traded in a narrow sideways trend, maintaining an overall uptrend and limiting itself to the support level of 1340.00.