
Тechnical analysis of currency pairs (Anton Hanzenko)
EUR USD (current price: 1.1860)
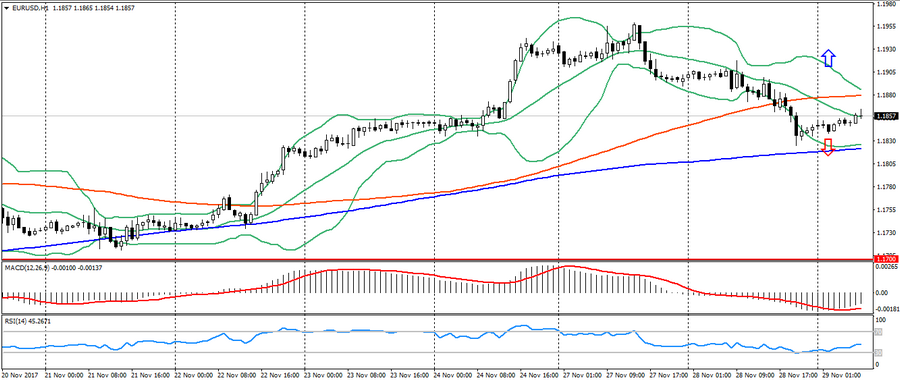
- Support levels: 1.1700 (August 2015 maximum), 1.1600 (2016 maximum), 1.1470.
- Levels of resistance: 1.2000, 1.2100, 1.2270 (November 2014 minimum).
- Computer analysis: MACD (signal – upward movement): the indicator is below 0, the signal line has left the body of the histogram. RSI is in the neutral zone. Bollinger Bands (period 20): neutral, declining volatility.
- The main recommendation: sale entry is started from 1.1880 (MA 100), 1.1910, 1.1950.
- Alternative recommendation: buy entry is started from 1.1820 (MA 200), 1.1800, 1.1780.
The euro remains in the correction phase after yesterday’s decline, also gaining support from the growth of geopolitical tensions. But the overall growth of the British puts pressure on the euro through the cross EUR/GBP.
GBP USD (current price: 1.3400)
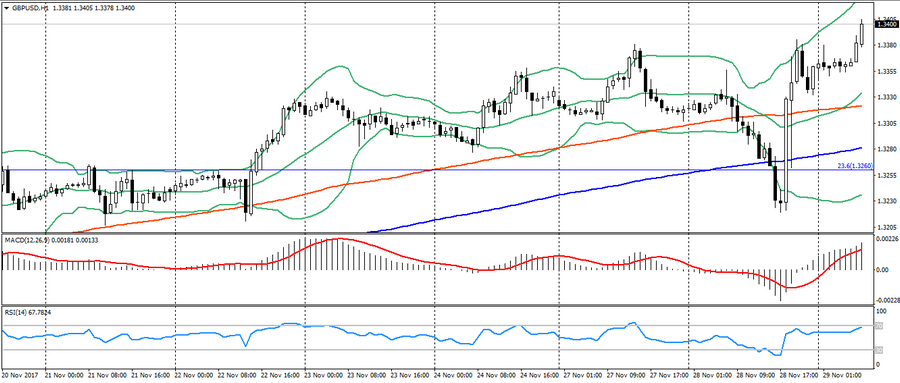
- Support levels: 1.3140, 1.2900, 1.2740 (August 2017 minimum).
- Resistance levels: 1.3500, 1.3660, 1.3830 (February 2016 minimum).
- Computer analysis: MACD (signal – upward movement): the indicator is above 0, the signal line is in the body of the histogram. RSI is in the overbought zone. Bollinger Bands (period 20): neutral, high volatility.
- The main recommendation: sale entry is started from 1.3400, 1.3420, 1.3450.
- Alternative recommendation: buy entry is started from 1.3340, 1.3320 (MA 100), 1.3280 (MA 200).
The British pound maintains a positive dynamics based on the data on the progress of negotiations between the EU and the UK.
USD CHF (current price: 0.9840)

- Support levels: 0.9700, 0.9600, 0.9530.
- Resistance levels: 1.0000, 1.0050, 1.0100 (May maximum).
- Computer analysis: MACD (signal – upward movement): the indicator is above 0, the signal line is in the body of the histogram. RSI is in the neutral zone. Bollinger Bands (period 20): neutral, low volatility.
- The main recommendation: sale entry is started from 0.9860 (MA 200), 0.9880 (Fibo.50.0 from the maximum of November 2016), 0.9900.
- Alternative recommendation: buy entry is started from 0.9820, 0.9800, 0.9770 (Fibo. 38.2 from the maximum of November 2016).
The Swiss franc continues to weaken on the correction after last week’s growth and the overall recovery of the American.
USD JPY (current price: 111.50)
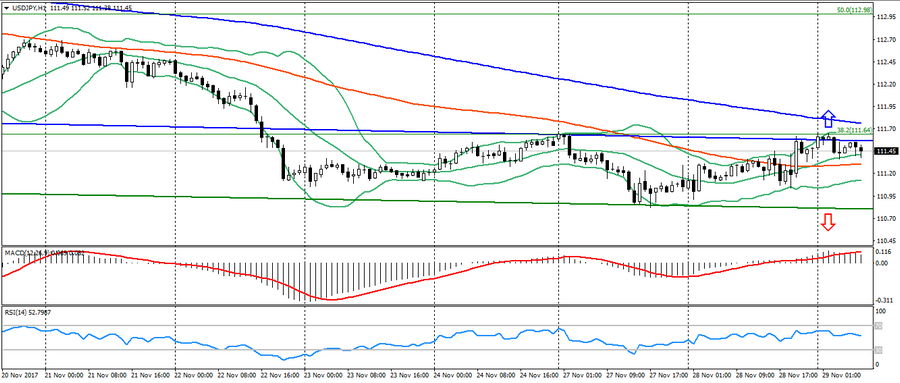
- Support levels: 108.90, 108.10 (April 2017 minimum), 107.30 (2017 minimum).
- Resistance levels: 113.70, 114.50 (July 2017 maximum), 115.00.
- Computer analysis: MACD (signal – upward movement): the indicator is above 0, the signal line is in the body of the histogram. RSI is in the neutral zone. Bollinger Bands (period 20): neutral, low volatility.
- The main recommendation: sale entry is started from 111.60 (Fibo. 38.2 from the maximum of December), 111.80 (MA 200), 112.20.
- Alternative recommendation: buy entry is started from 111.30 (MA 100), 111.00, 110.80.
The Japanese yen is clamped in the side channel, slightly strengthening on the rise of the geopolitical risks.
USD CAD (current price: 1.2810)
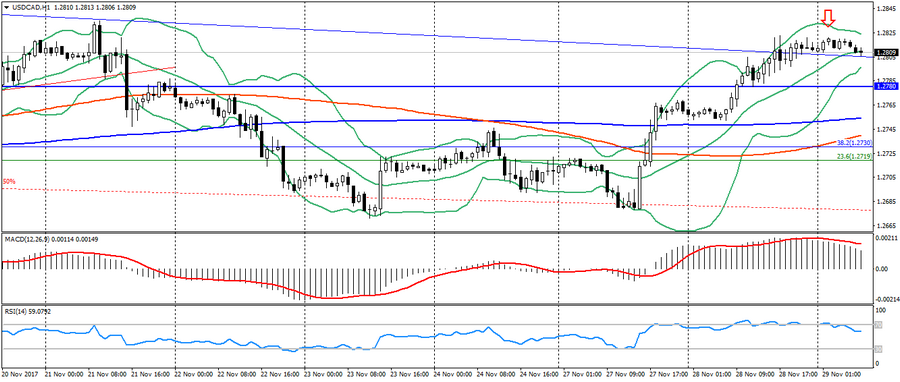
- Support levels: 1.2200, 1.2060 (2017 minimum), 1.1950 (2015 minimum).
- Resistance levels: 1.2780 (August 2017 maximum), 1.3000, 1.3160.
- Computer analysis: MACD (signal – downward movement): the indicator is higher than 0, the signal line has left the body of the histogram. RSI is in the neutral zone. Bollinger Bands (period 20): neutral, low volatility.
- The main recommendation: sale entry is started from 1.2830, 1.2850, 1.2870.
- Alternative recommendation: buy entry is started from 1.2780, 1.2750 (MA 200), 1.2630 (Fibo 38.2 from the May maximum).
The Canadian dollar remains under pressure of the negative dynamics of raw materials, but is limited by considerable oversold and significant resistance of 1.2820-30, from which one should expect correction.
AUD USD (current price: 0.7590)
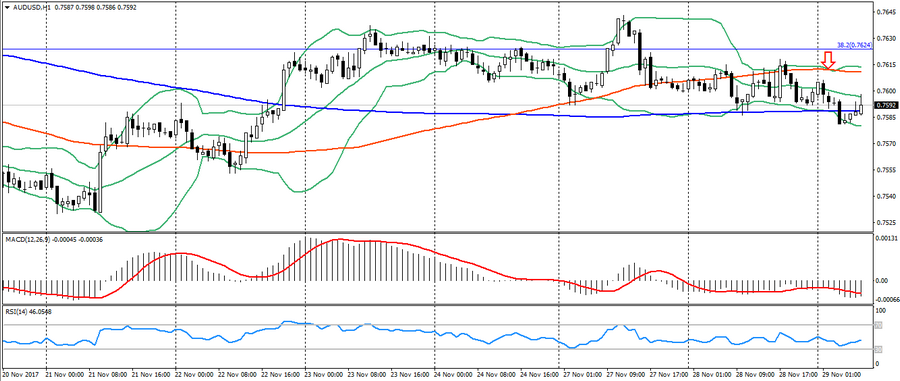
- Support levels: 0.7740, 0.7320 (2017 minimum), 0.7120.
- Resistance levels: 0.8120 (2017 maximum), 0.8200, 0.8290 (2014 maximum).
- Computer analysis: MACD (signal – downward movement): the indicator is below 0, the signal line is in the body of the histogram. RSI is in the neutral zone. Bollinger Bands (period 20): neutral, declining volatility.
- The main recommendation: sale entry is started from 0.7600, 0.7630 (Fibo. 38.2 from the low of January 2016), 0.7650.
- Alternative recommendation: buy entry is started from 0.7580, 0.7560, 0.7530.
The Australian continues to moderately weaken, thereby resuming the overall downward trend for this pair.
NZD USD (current price: 0.6910)
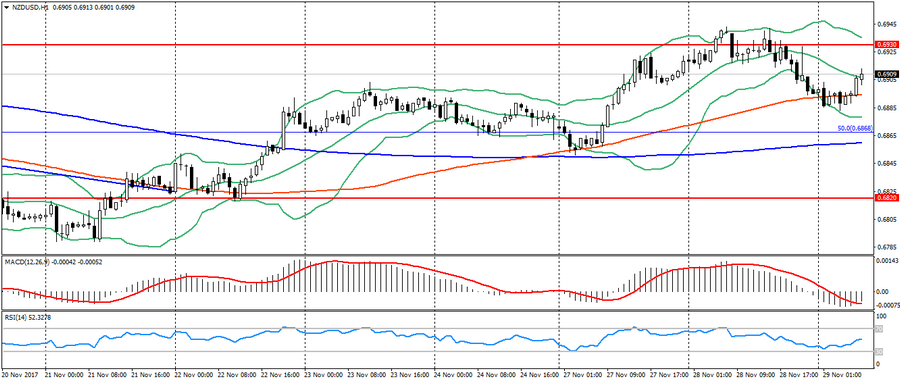
- Support levels: 0.7000, 0.6930, 0.6820 (the minimum of the current year).
- Resistance levels: 0.7380, 0.7450, 0.7550 (2017 maximum).
- Computer analysis: MACD (signal – upward movement): the indicator is below 0, the signal line has left the body of the histogram. RSI is in the neutral zone. Bollinger Bands (period 20): neutral, declining volatility.
- The main recommendation: sale entry is started from 0.6930, 0.6950, 0.6970.
- Alternative recommendation: buy entry is started from 0.6870 (Fibo.50 from the low of 2015), 0.6850 (MA 200), 0.6820.
The New Zealand dollar shows a slight increase, but it is also limited by resistance 0.6930-60.
XAU USD (current price: 1295.00)

- Support levels: 1250.00, 1226.00, 1200.00.
- Resistance levels: 1340.00, 1355.00, 1374.00 (2016 maximum).
- Computer analysis: MACD (signal – upward movement): the indicator is above 0, the signal line is in the body of the histogram. RSI is in the neutral zone. Bollinger Bands (period 20): neutral, declining volatility.
- The main recommendation: sale entry is started from 1297.00, 1299.00 (Fibo 38.2 from the July low), 1303.00.
- Alternative recommendation: buy entry is started from 1291.00 (MA 100), 1289.00, 1287.00 (MA 200).
Gold slightly strengthened on the geopolitics, thereby confirming the safety of the uptrend.