
Тechnical analysis of currency pairs (Anton Hanzenko)
EUR USD (current price: 1.1740)
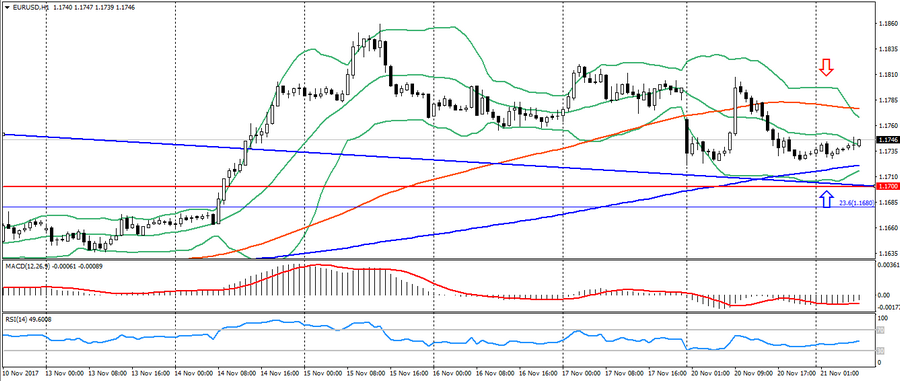
- Support levels: 1.1700 (August 2015 maximum), 1.1600 (2016 maximum), 1.1470.
- Resistance levels: 1.2000, 1.2100, 1.2270 (November 2014 minimum).
- Computer analysis: MACD (signal – upward motion): the indicator is below 0, the signal line has left the body of the histogram. RSI is in the neutral zone. Bollinger Bands (period 20): neutral, declining volatility.
- The main recommendation: entrance for sale from 1.1780 (MA 100), 1.1810, 1.1830.
- Alternative recommendation: buy-in from 1.1720 (MA 200), 1.1680 (Fibo 23.6 from the low of December 2016), 1.1650.
The euro moved into the correction phase after yesterday’s decline, but despite the expectation of correction, the single currency will remain under pressure due to the political risks in Germany.
GBP USD (current price: 1.3250)
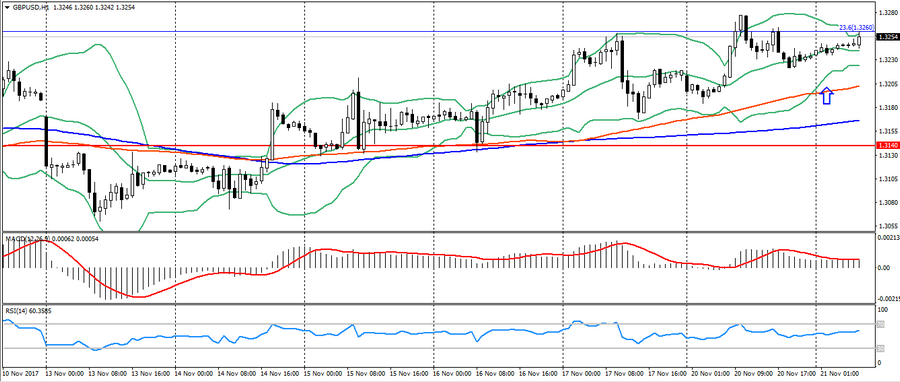
- Support levels: 1.3140, 1.2900, 1.2740 (August 2017 minimum).
- Resistance levels: 1.3500, 1.3660, 1.3830 (February 2016 minimum).
- Computer analysis: MACD (signal – upward motion): the indicator is above 0, the signal line is in the body of the histogram. RSI is in the neutral zone. Bollinger Bands (period 20): neutral, low volatility.
- The main recommendation: sale entry is started from 1.3270, 1.3300, 1.3340.
- Alternative recommendation: buy entry is started from 1.3200 (MA 100), 1.3160 (MA 200), 1.3140.
The British pound maintains an upward trend, receiving support through the cross EUR/GBP. The dynamics of the pair also remains limited to the overbought and common sideways trend.
USD CHF (current price: 0.9920)
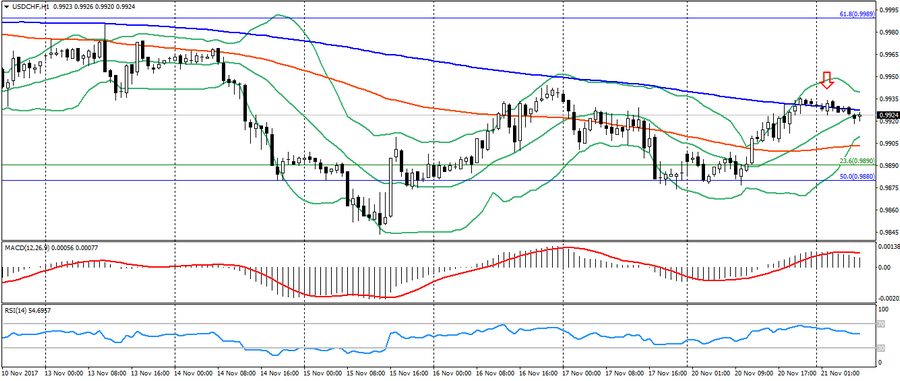
- Support levels: 0.9700, 0.9600, 0.9530.
- Resistance levels: 1.0000, 1.0050, 1.0100 (May maximum).
- Computer analysis: MACD (signal – downward motion): the indicator is higher than 0, the signal line has left the body of the histogram. RSI is in the neutral zone. Bollinger Bands (period 20): neutral, declining volatility.
- The main recommendation: sale entry is started from 0.9930 (MA 200), 0.9950, 0.9980.
- Alternative recommendation: buy entry is started from 0.9900 (MA 100), 0.9880 (Fibo.50.0 from the November 2016 high), 0.9850.
The Swiss franc also strengthened at the beginning of the day on correction after yesterday’s decline, thereby maintaining a common downward trend.
USD JPY (current price: 112.40)
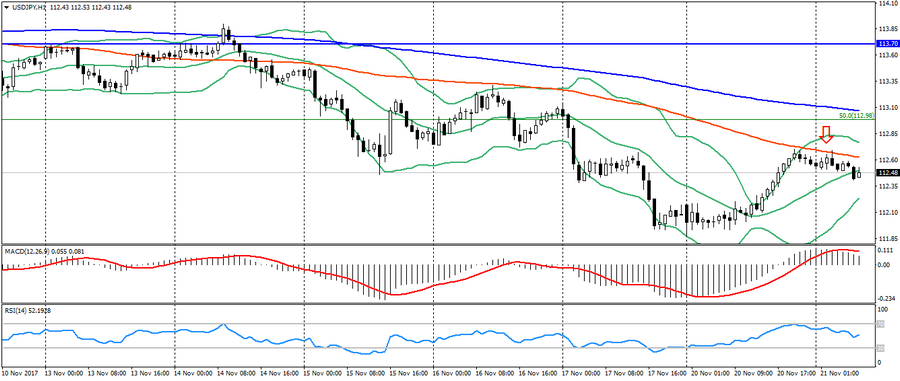
- Support levels: 108.90, 108.10 (April 2017 minimum), 107.30 (2017 minimum).
- Resistance levels: 113.70, 114.50 (July 2017 maximum), 115.00.
- Computer analysis: MACD (signal – downward motion): the indicator is higher than 0, the signal line has left the body of the histogram. RSI is in the neutral zone. Bollinger Bands (period 20): neutral, declining volatility.
- The main recommendation: sale entry is started from 112.60 (MA 100), 112.90 (Fibo.50.0 from the maximum of December), 113.30.
- Alternative recommendation: buy entry is started from 112.20, 112.00, 111.60 (Fibo. 38.2 from the maximum of December).
The Japanese yen also strengthened at the beginning of the day on the correction of the American, keeping the overall downward trend.
USD CAD (current price: 1.2800)
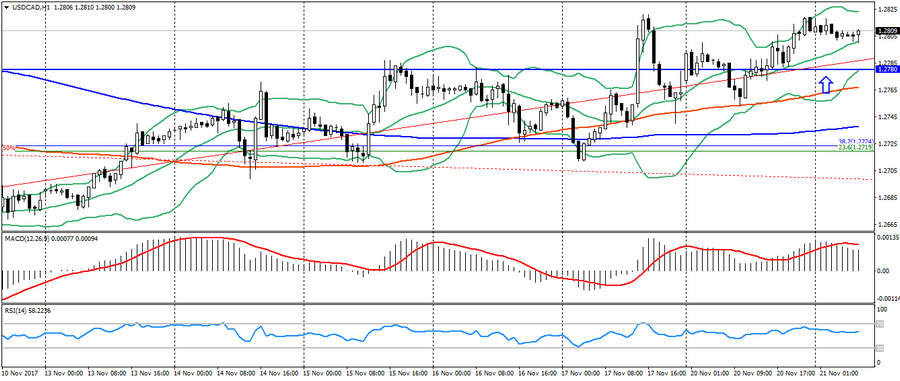
- Support levels: 1.2200, 1.2060 (2017 minimum), 1.1950 (2015 minimum).
- Resistance levels: 1.2780 (August 2017 maximum), 1.3000, 1.3160.
- Computer analysis: MACD (signal – downward motion): the indicator is higher than 0, the signal line has left the body of the histogram. RSI is in the neutral zone. Bollinger Bands (period 20): neutral, declining volatility.
- The main recommendation: sale entry is started from 1.2820, 1.2850, 1.2880.
- Alternative recommendation: buy entry is started from 1.2780, 1.2760 (MA 100), 1.2740 (MA 200).
The Canadian dollar maintains a downward trend.
AUD USD (current price: 0.7540)
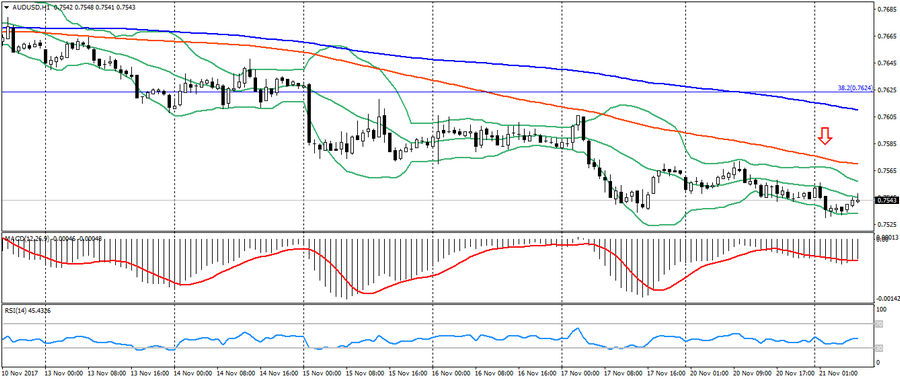
- Support levels: 0.7740, 0.7320 (2017 minimum), 0.7120.
- Resistance levels: 0.8120 (2017 maximum), 0.8200, 0.8290 (2014 maximum).
- Computer analysis: MACD (signal – downward motion): the indicator is below 0, the signal line is in the body of the histogram. RSI is in the neutral zone. Bollinger Bands (period 20): neutral, low volatility.
- The main recommendation: sale entry is started from 0.7570 (MA 100), 0.7610 (MA 200), 0.7650.
- Alternative recommendation: buy entry is started from 0.7520, 0.7500, 0.7480.
The Australian is also trading with a slight decrease due to the publication of the ambiguous RBA protocol.
NZD USD (current price: 0.6810)
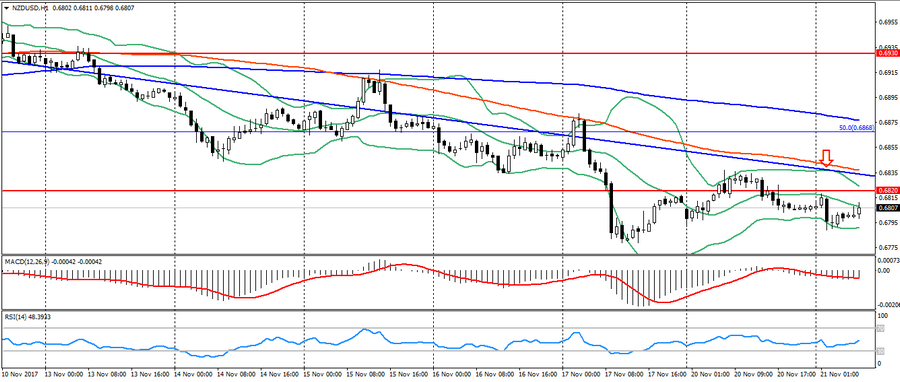
- Support levels: 0.7000, 0.6930, 0.6820 (the minimum of the current year).
- Resistance levels: 0.7380, 0.7450, 0.7550 (2017 maximum).
- Computer analysis: MACD (signal – downward motion): the indicator is below 0, the signal line has left the body of the histogram. RSI is in the neutral zone. Bollinger Bands (period 20): neutral, low volatility.
- The main recommendation: sale entry is started from 0.6820, 0.6840 (MA 100), 0.6880.
- Alternative recommendation: buy entry is started from 0.6790, 0.6770 (November low), 0.6750.
The New Zealand dollar is also trading downward maintaining the downtrend.
XAU USD (current price: 1280.00)
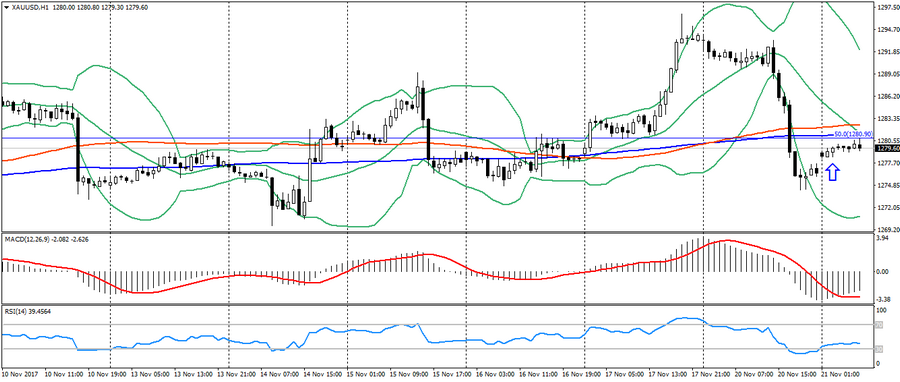
- Support levels: 1250.00, 1226.00, 1200.00.
- Resistance levels: 1340.00, 1355.00, 1374.00 (2016 maximum).
- Computer analysis: MACD (signal – upward motion): the indicator is below 0, the signal line has left the body of the histogram. RSI is in the neutral zone. Bollinger Bands (period 20): neutral, declining volatility.
- The main recommendation: sale entry is started from 1281.00, 1286.00, 1291.00.
- Alternative recommendation: buy entry is started from 1277.00, 1274.00, 1270.00.
Gold remains in the correction phase after yesterday’s rapid decline, thereby maintaining an upward trend.