
Тechnical analysis of currency pairs (Anton Hanzenko)
EUR USD (current price: 1.1780)
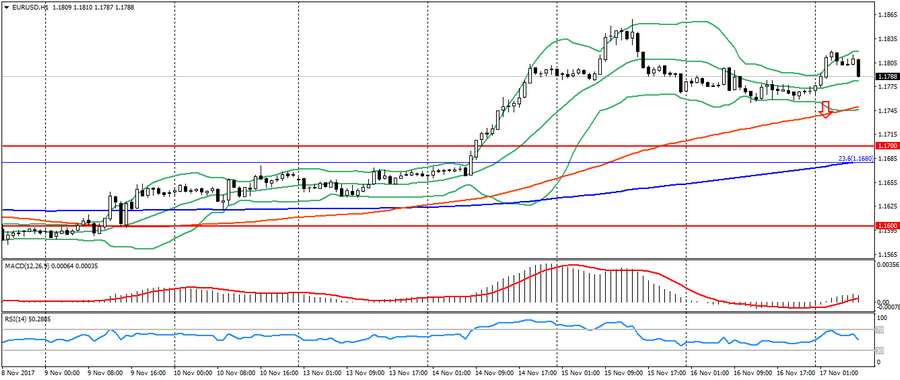
- Support levels: 1.1700 (August 2015 maximum), 1.1600 (2016 maximum), 1.1470.
- Levels of resistance: 1.2000, 1.2100, 1.2270 (November 2014 minimum).
- Computer analysis: MACD (signal – upward motion): the indicator is above 0, the signal line is in the body of the histogram. RSI is in the neutral zone. Bollinger Bands (period 20): neutral, declining volatility.
- The main recommendation: sale entry is started from 1.1840, 1.1860, 1.1880.
- Alternative recommendation: buy entry is started from 1.1760, 1.1740 (MA 100), 1.1680 (Fibo.2.6 from the low of December 2016).
Euro is trading in different directions based on the ambiguous dynamics of the American, but remains in the correction phase.
GBP USD (current price: 1.3240)
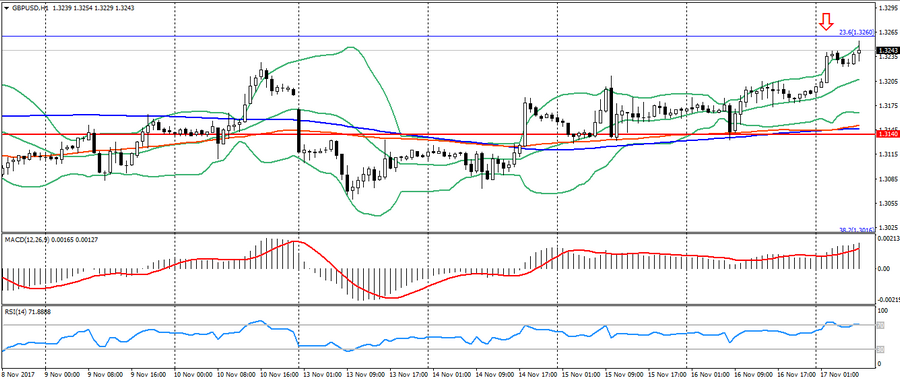
- Support levels: 1.3140, 1.2900, 1.2740 (August 2017 minimum).
- Resistance levels: 1.3500, 1.3660, 1.3830 (February 2016 minimum).
- Computer analysis: MACD (signal – upward movement): the indicator is above 0, the signal line is in the body of the histogram. RSI is in the overbought zone. Bollinger Bands (period 20): overbought, growing volatility.
- The main recommendation: sale entry is started from 1.3240, 1.3260 (Fibo. 23.6 from the January’s low), 1.3290.
- Alternative recommendation: buy entry is started from 1.3200, 1.3160, 1.3140 (MA 200).
The British pound markedly accelerated growth early in the day based on positive data on employment in the UK, which came out yesterday, and on the general weakness of the American. But the dynamics of the pair is limited by the existing lateral trend.
USD CHF (current price: 0.9910)
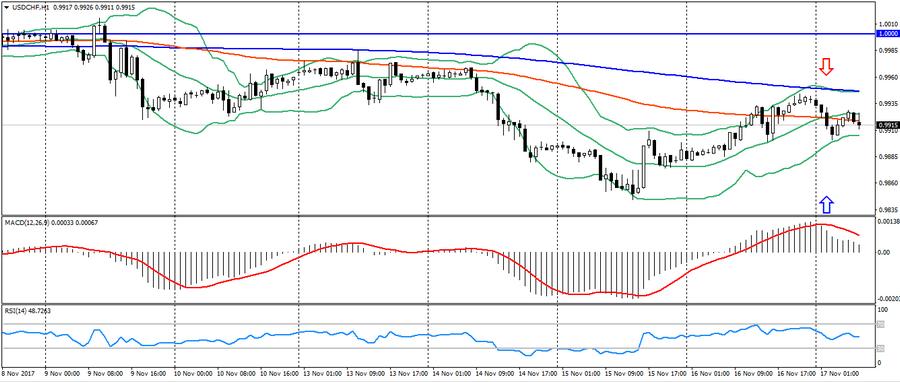
- Support levels: 0.9700, 0.9600, 0.9530.
- Resistance levels: 1.0000, 1.0050, 1.0100 (May maximum).
- Computer analysis: MACD (signal – downward motion): the indicator is higher than 0, the signal line has left the body of the histogram. RSI is in the neutral zone. Bollinger Bands (period 20): neutral, low volatility.
- The main recommendation: sale entry is started from 0.9950 (MA 200), 0.9980 (MA 200), 1.0000.
- Alternative recommendation: buy entry is started from 0.9870 (MA 200 to H4), 0.9850, 0.9810.
The Swiss franc slightly strengthened, but still maintains a sideways trend.
USD JPY (current price: 112.50)
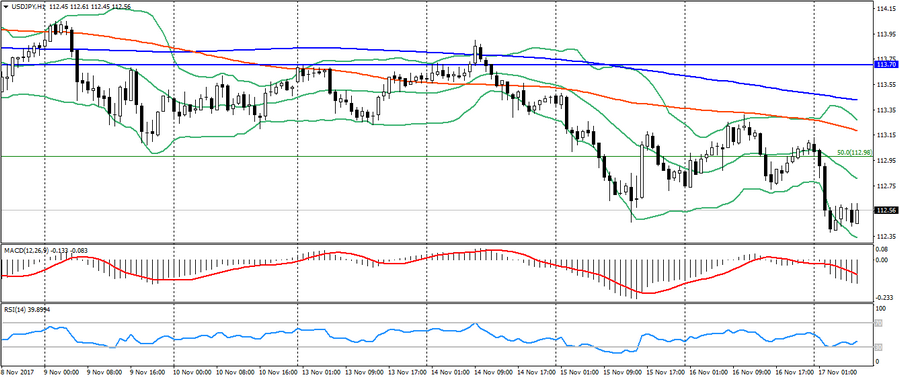
- Support levels: 108.90, 108.10 (April 2017 minimum ), 107.30 (2017 minimum).
- Resistance levels: 113.70, 114.50 (July 2017 maximum), 115.00.
- Computer analysis: MACD (signal – downward motion): the indicator is below 0, the signal line is in the body of the histogram. RSI is in the neutral zone. Bollinger Bands (period 20): neutral, declining volatility.
- The main recommendation: sale entry is started from 112.70 (MA 100), 113.00 (Fibo. 50.0 from the maximum of December), 113.30.
- Alternative recommendation: buy entry is started from 112.30, 112.00, 111.60 (Fibo. 38.2 from the maximum of December).
The Japanese yen strengthened against the dollar at the beginning of the day, which was caused by the growth of political pressure in the States.
USD CAD (current price: 1.2750)
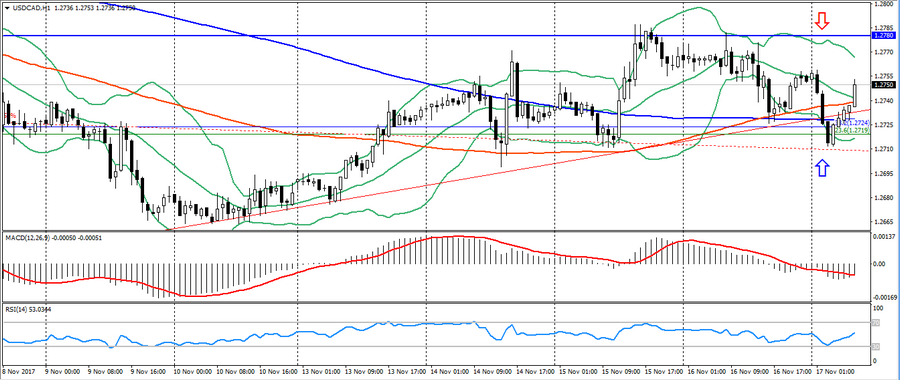
- Support levels: 1.2200, 1.2060 (2017 minimum), 1.1950 (2015 minimum).
- Resistance levels: 1.2780 (August 2017 maximum), 1.3000, 1.3160.
- Computer analysis: MACD (signal – downward motion): the indicator is below 0, the signal line is in the body of the histogram. RSI is in the neutral zone. Bollinger Bands (period 20): neutral, low volatility.
- The main recommendation: sale entry is started from 1.2750 (MA 200), 1.2780, 1.2790.
- Alternative recommendation: buy entry is started from 1.2710 (MA 200), 1.2690, 1.2670.
The Canadian dollar shows mixed dynamics due to the change in the market’s sentiments after the sale of the American at the beginning of the day.
AUD USD (current price: 0.7550)
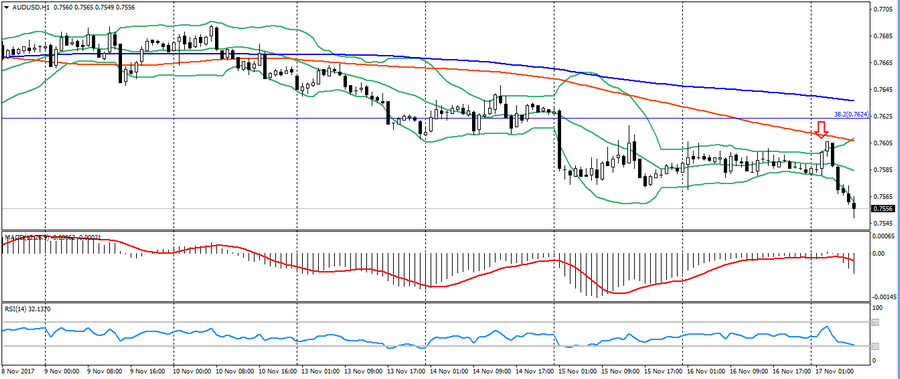
- Support levels: 0.7740, 0.7320 ( 2017 minimum ), 0.7120.
- Resistance levels: 0.8120 (2017 maximum), 0.8200, 0.8290 (2014 maximum).
- Computer analysis: MACD (signal – upward motion): the indicator is below 0, the signal line is in the body of the histogram. RSI is in the oversold zone. Bollinger Bands (period 20): oversold, growing volatility.
- The main recommendation: sale entry is started from 0.7610 (MA 100), 0.7630 (Fibo. 38.2 from the low of 2016), 0.7650.
- Alternative recommendation: buy entry is started from 0.7550, 0.7530, 0.7500.
The Australian also weakened after attempts at growth, which is caused by the general weakness of commodity currencies.
NZD USD (current price: 0.6820)
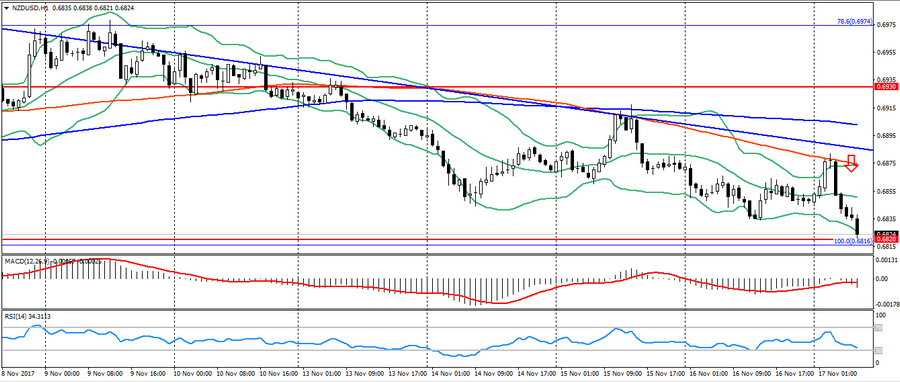
- Support levels: 0.7000, 0.6930, 0.6820 (the minimum of the current year).
- Resistance levels: 0.7380, 0.7450, 0.7550 (2017 maximum).
- Computer analysis: MACD (signal – downward motion): the indicator is below 0, the signal line is in the body of the histogram. RSI is in the neutral zone. Bollinger Bands (period 20): oversold, growing volatility.
- The main recommendation: sale entry is started from 0.6870 (MA 100), 0.6900 (MA 200), 0.6930.
- Alternative recommendation: buy entry is started from 0.6830, 0.6820 (October low), 0.6800.
The New Zealand dollar is also trading near the lows, waiting for the development of the “head and shoulders” figure.
XAU USD (current price: 1281.00)
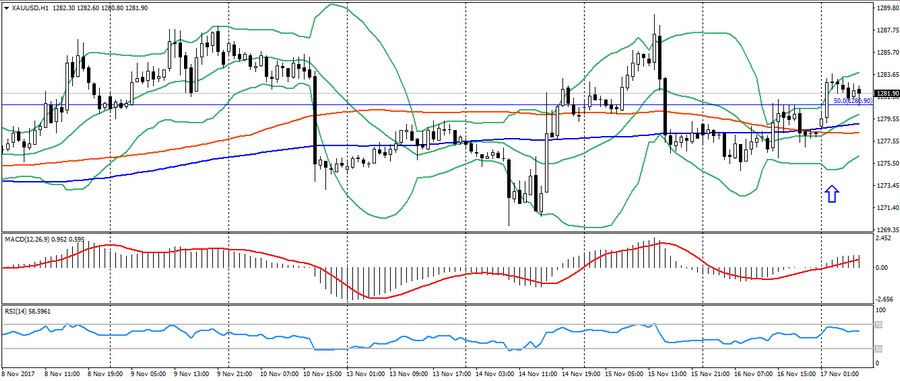
- Support levels: 1250.00, 1226.00, 1200.00.
- Resistance levels: 1340.00, 1355.00, 1374.00 (2016 maximum).
- Computer analysis: MACD (signal – upward motion): the indicator is above 0, the signal line is in the body of the histogram. RSI is in the neutral zone. Bollinger Bands (period 20): neutral, declining volatility.
- The main recommendation: sale entry is started from 1284.00 (Fibo. 50.0 from the July low), 1287.00, 1290.00.
- Alternative recommendation: buy entry is started from 1279.00 (MA 200), 1275.00, 1270.00.
Gold also weakened based on correction after growth at the beginning of the day, keeping the sideways trend.