
Тechnical analysis of currency pairs (Anton Hanzenko)
EUR USD (current price: 1.1640)
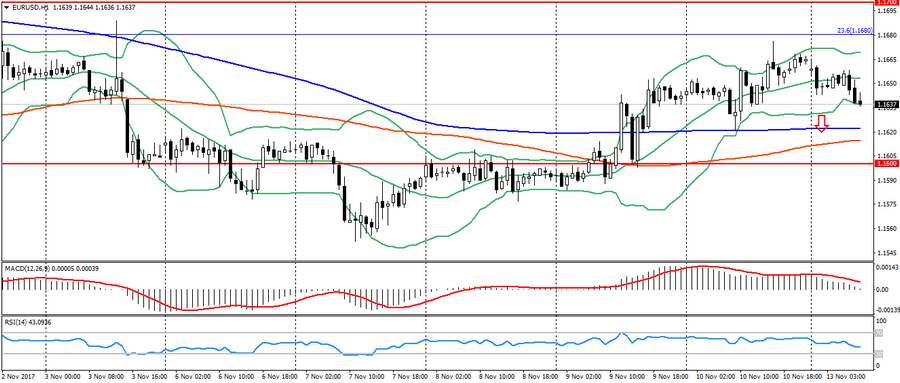
- Support levels: 1.1700 (August 2015 maximum), 1.1600 (2016 maximum), 1.1470.
- Resistance levels: 1.2000, 1.2100, 1.2270 (November 2014 minimum).
- Computer analysis: MACD (signal – downward motion): the indicator is higher than 0, the signal line has left the body of the histogram. RSI is in the neutral zone. Bollinger Bands (period 20): neutral, growing volatility.
- The main recommendation: sale entry is started from 1.1660, 1.1680 (Fibo. 23.6 from the low of December 2016), 1.1700.
- Alternative recommendation: buy entry is started from 1.1620 (MA 200), 1.1600, 1.1580.
The euro was under pressure at the beginning of the day on a correction against Friday and the strengthening of the American. As a result, the pair is trading near the low of Friday, limiting itself to an uptrend. The breakthrough of level 1.1620 will indicate the possibility of a trend reversal.
GBP USD (current price: 1.3090)
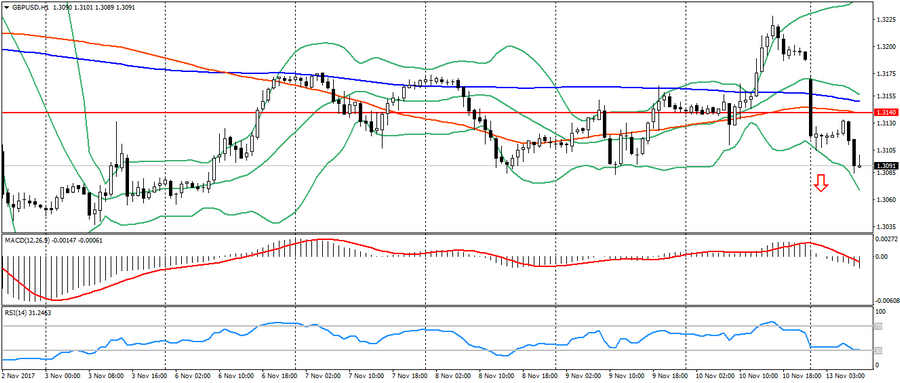
- Support levels: 1.3140, 1.2900, 1.2740 (August 2017 minimum).
- Resistance levels: 1.3500, 1.3660, 1.3830 (February 2016 minimum).
- Computer analysis: MACD (signal – downward motion): the indicator is below 0, the signal line is in the body of the histogram. RSI is in the oversold zone. Bollinger Bands (period 20): neutral, growing volatility.
- The main recommendation: sale entry is started from 1.3150 (MA 200), 1.3180, 1.3220.
- Alternative recommendation: buy entry is started from 1.3080, 1.3050, 1.3030.
The British pound weakened across the spectrum of the market because of the aggravation of political tension in Britain. As a result, the pair is limited to the last Wednesday’s minimums and remains prone to decline.
USD CHF (current price: 0.9970)
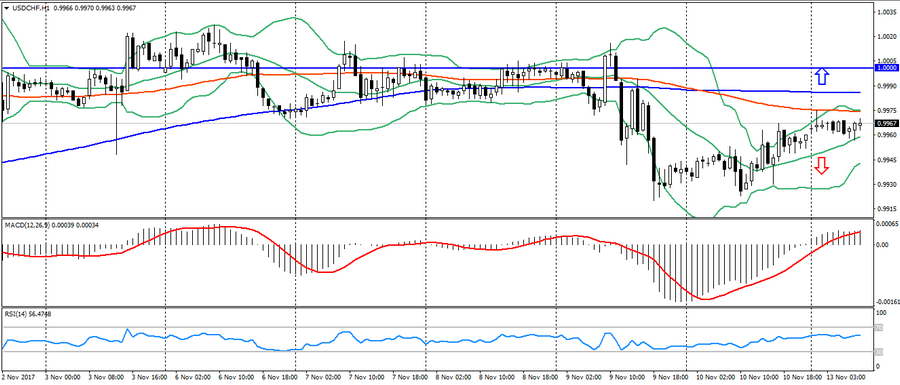
- Support levels: 0.9700, 0.9600, 0.9530.
- Resistance levels: 1.0000, 1.0050, 1.0100 (May maximum).
- Computer analysis: MACD (signal – upward motion): the indicator is above 0, the signal line is in the body of the histogram. RSI is in the neutral zone. Bollinger Bands (period 20): neutral, declining volatility.
- The main recommendation: sale entry is started from 0.9980 (MA 200), 1.0000, 1.0020.
- Alternative recommendation: buy entry is started from 0.9940, 0.9920, 0.9900.
The Swiss franc is trading at the opening level of the day, which is caused by the continued uncertainty in the stock exchanges and the risks associated with the tax reform in the US.
USD JPY (current price: 113.50)
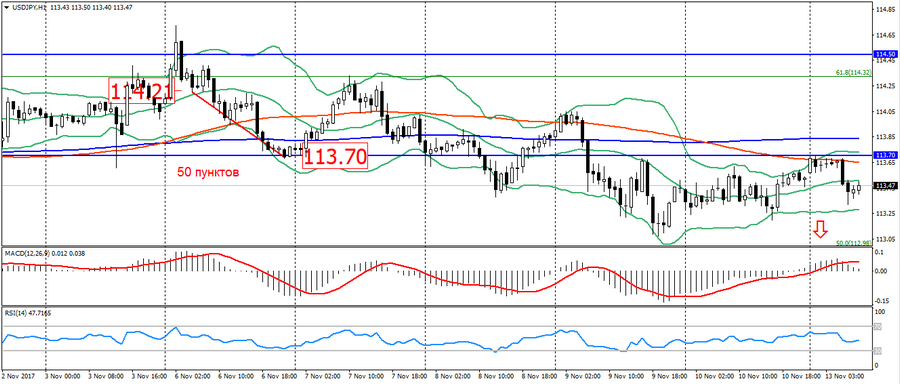
- Support levels: 108.90, 108.10 (April 2017 minimum), 107.30 (2017 minimum).
- Resistance levels: 113.70, 114.50 (July 2017 maximum), 115.00.
- Computer analysis: MACD (signal – downward motion): the indicator is higher than 0, the signal line has left the body of the histogram. RSI is in the neutral zone. Bollinger Bands (period 20): neutral, growing volatility.
- The main recommendation: sale entry is started from 113.70, 113.90 (MA 200), 114.10.
- Alternative recommendation: buy entry is started from 113.20, 112.90 (Fibo. 50.0 from the maximum of December 2016), 112.60.
The Japanese yen slightly strengthened early in the day based on the comments of the Central Bank of Japan and uncertainty in the market, but the overall dynamics of the pair remains low-key.
USD CAD (current price: 1.2700)
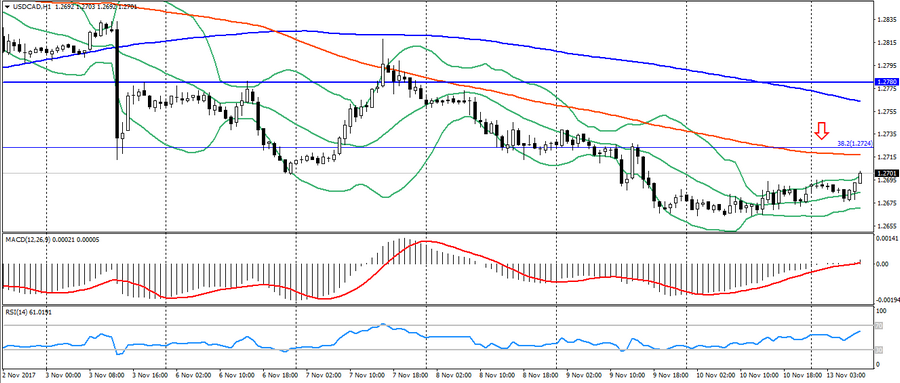
- Support levels: 1.2200, 1.2060 (2017 minimum), 1.1950 (2015 minimum).
- Resistance levels: 1.2780 (August 2017 maximum), 1.3000, 1.3160.
- Computer analysis: MACD (signal – upward motion): the indicator is above 0, the signal line is in the body of the histogram. RSI is in the neutral zone. Bollinger Bands (period 20): overbought, growing volatility.
- The main recommendation: sale entry is started from 1.2730 (Fibo. 38.2 from the May maximum), 1.2750, 1.2780.
- Alternative recommendation: buy entry is started from 1.2670, 1.2650, 1.2610 (MA 200 per H4).
The Canadian dollar was under pressure of correction against last week, but the corrective movement for this pair remains limited by the level of 1.2730-50
AUD USD (current price: 0.7640)
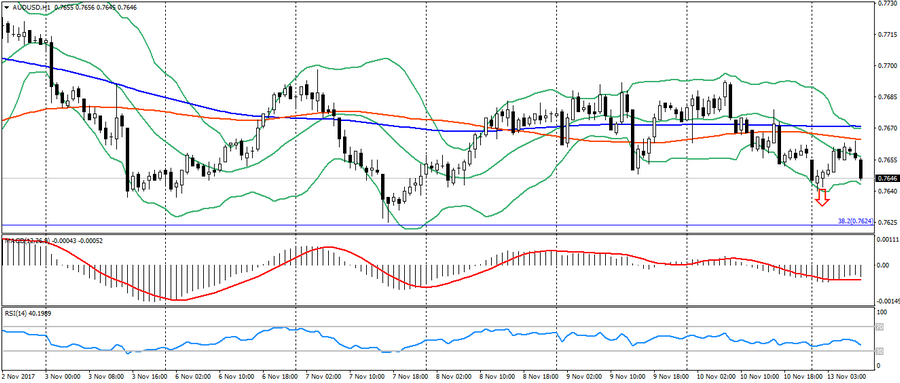
- Support levels: 0.7740, 0.7320 (2017 minimum), 0.7120.
- Resistance levels: 0.8120 (2017 maximum), 0.8200, 0.8290 (2014 maximum).
- Computer analysis: MACD (signal – upward motion): the indicator is below 0, the signal line has left the body of the histogram. RSI is in the neutral zone. Bollinger Bands (period 20): neutral, growing volatility.
- The main recommendation: sale entry is started from 0.7670 (MA 200), 0.7690, 0.7700.
- Alternative recommendation: buy entry is started from 0.7640, 0.7620 (Fibo. 38.2 from the low of January 2016), 0.7600.
The Australian remains under pressure based on the growth of the American, but the overall dynamics of the pair is limited to a lateral trend.
NZD USD (current price: 0.6910)
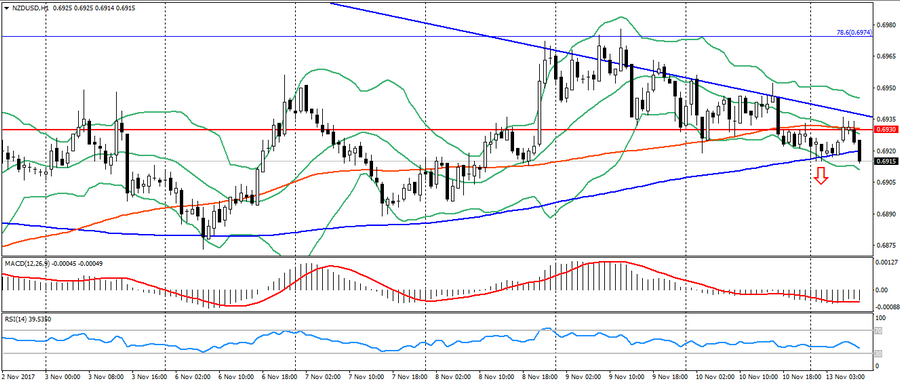
- Support levels: 0.7000, 0.6930, 0.6820 (the minimum of the current year).
- Resistance levels: 0.7380, 0.7450, 0.7550 (2017 maximum).
- Computer analysis: MACD (signal – downward motion): the indicator is below 0, the signal line is in the body of the histogram. RSI is in the neutral zone. Bollinger Bands (period 20): neutral, growing volatility.
- The main recommendation: sale entry is started from 0.6940, 0.6960, 0.7000.
- Alternative recommendation: buy entry is started from 0.6910, 0.6890, 0.6870.
The New Zealand dollar also is under pressure of the American.
XAU USD (current price: 1276.00)
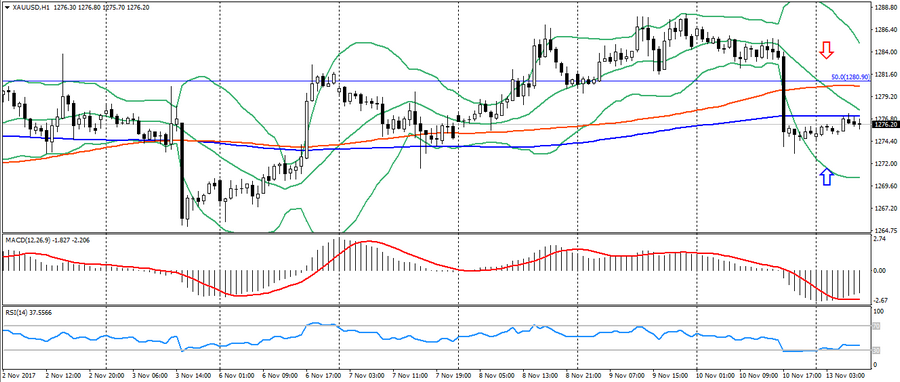
- Support levels: 1250.00, 1226.00, 1200.00.
- Resistance levels: 1340.00, 1355.00, 1374.00 (2016 maximum).
- Computer analysis: MACD (signal – downward motion): the indicator is below 0, the signal line has left the body of the histogram. RSI is in the neutral zone. Bollinger Bands (period 20): neutral, declining volatility.
- The main recommendation: sale entry is started from 1290.00 (Fibo. 50.0 from the July low), 1284.00, 1287.00.
- Alternative recommendation: buy entry is started from 1274.00, 1270.00, 1268.00.
Gold slightly strengthened at the beginning of the day, but is still trading very restrained near significant support levels.