
Тechnical analysis of currency pairs (Anton Hanzenko)
EUR USD (current price: 1.1610)
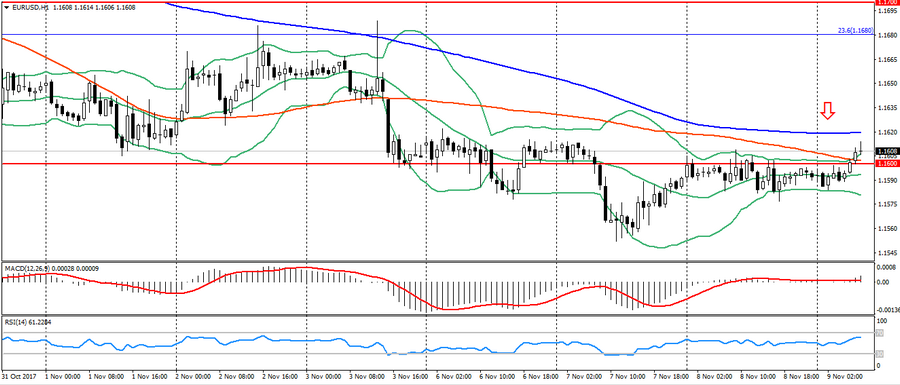
Support levels: 1.1700 (August 2015 maximum), 1.1600 (2016 maximum), 1.1470.
Levels of resistance: 1.2000, 1.2100, 1.2270 (November 2014 minimum).
Computer analysis: MACD (signal – upward motion): the indicator is above 0, the signal line is in the body of the histogram. RSI is in the neutral zone. Bollinger Bands (period 20): overbought, growing volatility.
The main recommendation: sale entry is started from 1.1620 (MA 200), 1.1640, 1.1670.
Alternative recommendation: buy entry is started from 1.1580, 1.1550, 1.1520.
The euro slightly strengthened early in the day on the weakness of the American, but still trading in the sideways trend.
GBP USD (current price: 1.3140)
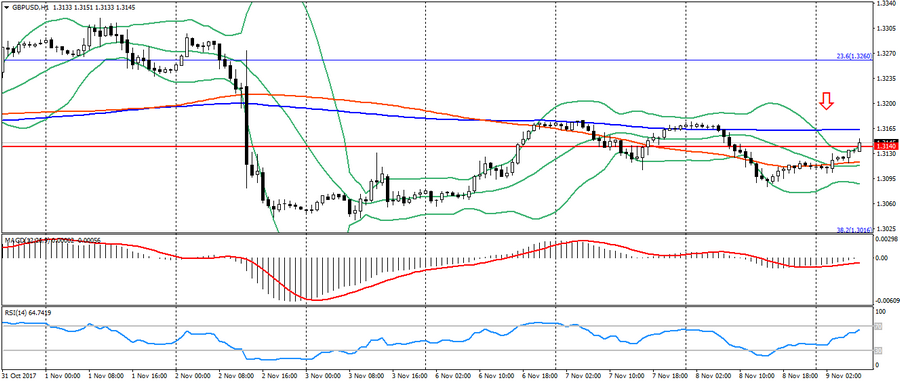
Support levels: 1.3140, 1.2900, 1.2740 (the minimum of August 2017).
Resistance levels: 1.3500, 1.3660, 1.3830 (February 2016 minimum).
Computer analysis: MACD (signal – upward motion): the indicator is below 0, the signal line has left the body of the histogram. RSI is in the neutral zone. Bollinger Bands (period 20): neutral, growing volatility.
The main recommendation: sale entry is started from 1.3160 (MA 200), 1.3180, 1.3220.
Alternative recommendation: buy entry is started from 1.3110 (MA 100), 1.3080, 1.3050.
The British pound also strengthened on the weakness of the dollar, but is limited to a sideways trend.
USD CHF (current price: 0.9980)
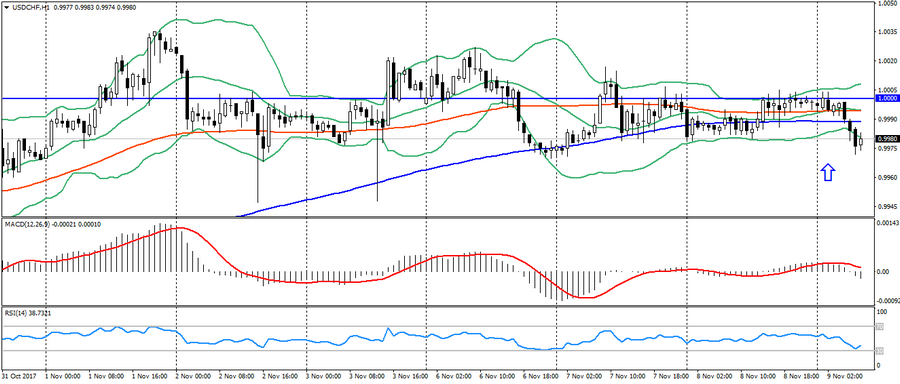
Support levels: 0.9700, 0.9600, 0.9530.
Resistance levels: 1.0000, 1.0050, 1.0100 (May maximum).
Computer analysis: MACD (signal – downward motion): the indicator is higher than 0, the signal line has left the body of the histogram. RSI is in the light oversold zone. Bollinger Bands (period 20): oversold, growing volatility.
The main recommendation: sale entry is started from 0.9980 (MA 100), 1.0000, 1.0020.
Alternative recommendation: buy entry is started from 0.9970, 0.9950, 0.9930.
The Swiss franc maintains a sideways trend while limited to Tuesday’s lows.
USD JPY (current price: 113.50)
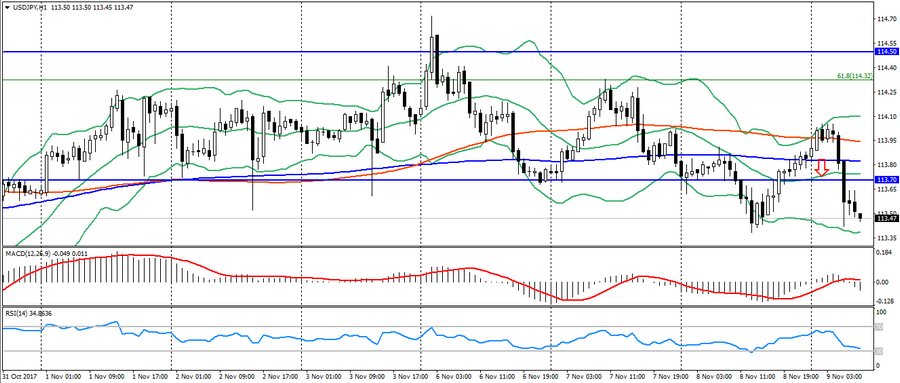
Support levels: 108.90, 108.10 (April 2017 minimum), 107.30 (2017 minimum).
Resistance levels: 113.70, 114.50 (July 2017 maximum), 115.00.
Computer analysis: MACD (signal-flat): the indicator is near 0. RSI is in the neutral zone. Bollinger Bands (period 20): neutral, growing volatility.
The main recommendation: sale entry is started from 113.70, 114.00 (MA 100), 114.30 (Fibo. 61.8 from the maximum of December 2016).
Alternative recommendation: buy entry is started from 113.30, 113.00, 112.80.
The Japanese yen strengthened significantly early in the day on the flight of investors from risks and is processing technical signals.
USD CAD (current price: 1.2720)
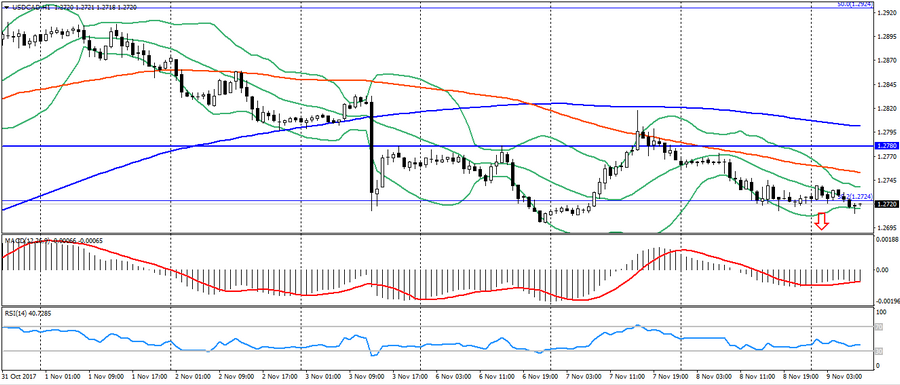
Support levels: 1.2200, 1.2060 (2017 minimum), 1.1950 (2015 minimum).
Resistance levels: 1.2780 (August 2017 maximum), 1.3000, 1.3160.
Computer analysis: MACD (signal – downward motion): the indicator is below 0, the signal line is in the body of the histogram. RSI is in the neutral zone. Bollinger Bands (period 20): neutral, low volatility.
The main recommendation: sale entry is started from 1.2750 (MA 100), 1.2780, 1.2800 (MA 200).
Alternative recommendation: buy entry is started from 1.2700, 1.2680 (Fibo.38.2 from the May maximum), 1.2650.
The Canadian dollar is trading in a narrow flat after yesterday’s growth and maintains the potential for strengthening.
AUD USD (current price: 0.7680)
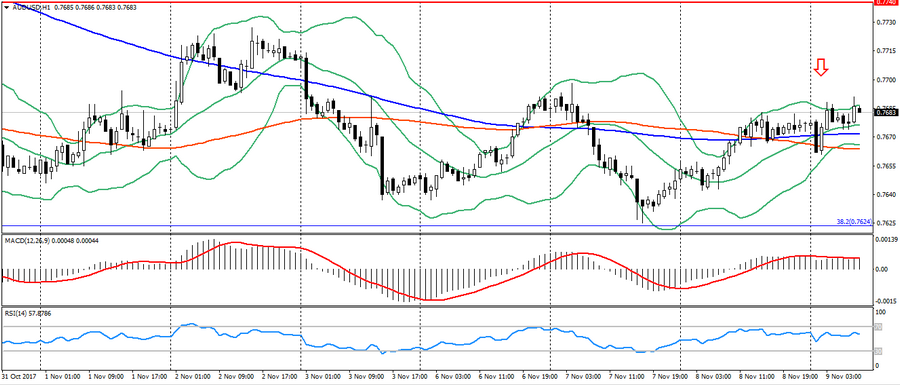
Support levels: 0.7740, 0.7320 (2017 minimum), 0.7120.
Resistance levels: 0.8120 (2017 maximum), 0.8200, 0.8290 (2014 maximum).
Computer analysis: MACD (signal – upward motion): the indicator is above 0, the signal line is in the body of the histogram. RSI is in the neutral zone. Bollinger Bands (period 20): neutral, low volatility.
The main recommendation: sale entry is started from 0.7690 (MA 200), 0.7720, 0.7740.
Alternative recommendation: buy entry is started from 0.7660 (MA 100), 0.7640, 0.7620 (Fibo 38.2 from the low of January 2016).
The Australian dollar slightly strengthened early in the day on the positive dynamics of raw materials, but is limited to a general downward trend.
NZD USD (current price: 0.6970)
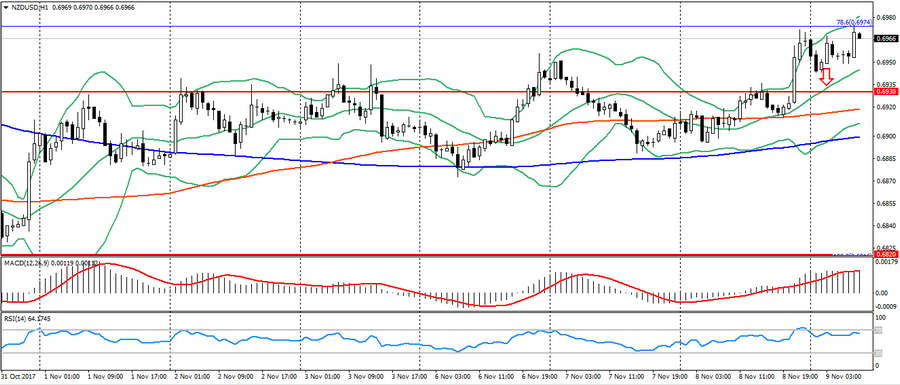
Support levels: 0.7000, 0.6930, 0.6820 (the minimum of the current year).
Resistance levels: 0.7380, 0.7450, 0.7550 (2017 maximum).
Computer analysis: MACD (signal – upward motion): the indicator is above 0, the signal line is in the body of the histogram. RSI is in the neutral zone. Bollinger Bands (period 20): neutral, declining volatility.
The main recommendation: sale entry is started from 0.6970 (Fibo. 78.6 from the May low), 0.7000, 0.7020.
Alternative recommendation: buy entry is started from 0.6930, 0.6920 (MA 100), 0.6900 (MA 200).
The New Zealand dollar rose based on the RBNZ data, but is limited in growth by the resistance level of 0.6980.
XAU USD (current price: 1283.00)
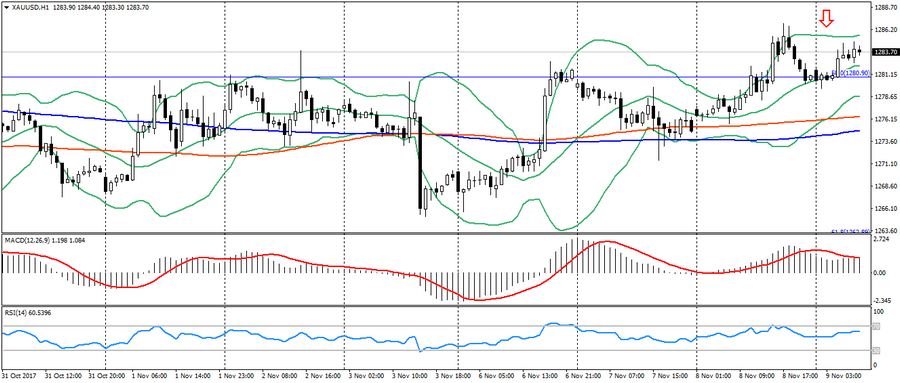
Support levels: 1250.00, 1226.00, 1200.00.
Resistance levels 1340.00, 1355.00, 1374.00 (2016 maximum).
Computer analysis: MACD (signal – upward motion): the indicator is above 0, the signal line is in the body of the histogram. RSI is in the neutral zone. Bollinger Bands (period 20): neutral, growing volatility.
The main recommendation: sale entry is started from 1286.00, 1289.00 (Fibo. 50.0 from the July’s low) (MA200), 1292.00.
Alternative recommendation: buy entry is started from 1280.00, 1276.00 (MA 100), 1273.00.
Gold slightly strengthened early in the day on the flight of investors from risks, but the overall dynamics of gold remains limited to the lateral trend, which has expanded.