
Технический анализ валютных пар (Антон Ганзенко)
EUR USD (current price: 1.1580)
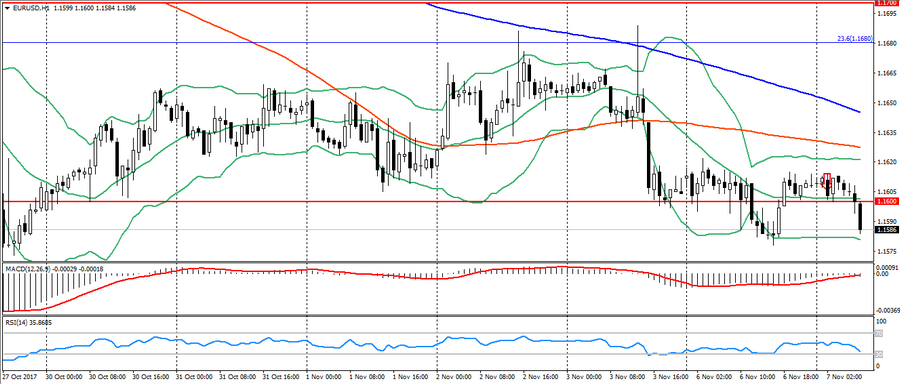
- Support levels: 1.1700 (August 2015 maximum), 1.1600 (2016 maximum), 1.1470.
- Levels of resistance: 1.2000, 1.2100, 1.2270 (November 2014 minimum).
- Computer analysis: MACD (signal – downward motion): the indicator is below 0, the signal line is in the body of the histogram. RSI is in the oversold zone. Bollinger Bands (period 20): neutral, growing volatility.
- The main recommendation: sale entry is started from 1.1620, 1.1640 (MA 200), 1.1660.
- Alternative recommendation: buy entry is started from 1.1600 (strong psychology), 1.1580, 1.1550.
The euro sharply accelerated the decline in the beginning of the European session based on the renewal of demand for the American. Yesterday’s breakthrough of support 1.1600 continues to indicate the possibility of further decline of this pair and the preservation of a downtrend. The day is full of speeches, which will cause the growth of volatility.
GBP USD (current price: 1.3150)
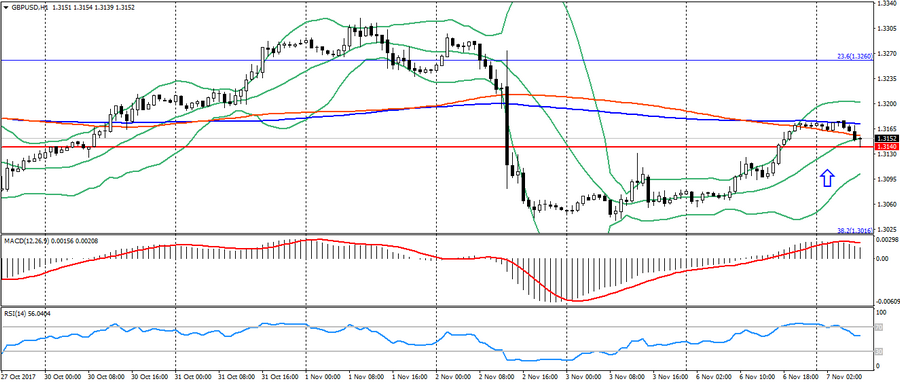
- Support levels: 1.3140, 1.2900, 1.2740 (August 2017 minimum).
- Resistance levels: 1.3500, 1.3660, 1.3830 (February 2016 minimum).
- Computer analysis: MACD (signal – downward motion): the indicator is higher than 0, the signal line has left the body of the histogram. RSI is in the neutral zone. Bollinger Bands (period 20): neutral, declining volatility.
- The main recommendation: sale entry is started from 1.3180 (MA 200), 1.3220, 1.3260 (Fibo. 23.6 from the January low).
- Alternative recommendation: buy entry is started from 1.3140, 1.3100, 1.3040.
The British pound was also under pressure of the American and correction after growth, but given the strong position of the pound in cross-rates, the correction for GBP/USD will be limited.
USD CHF (current price: 1.0000)
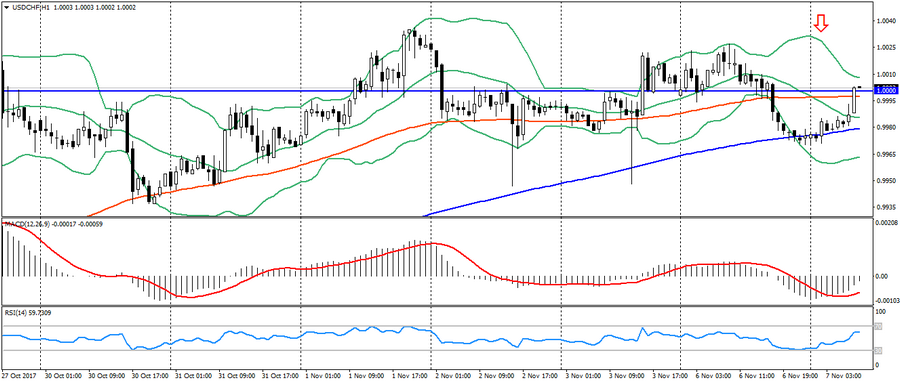
- Support levels: 0.9700, 0.9600, 0.9530.
- Resistance levels: 1.0000, 1.0050, 1.0100 (May maximum).
- Computer analysis: MACD (signal – upward motion): the indicator is below 0, the signal line has left the body of the histogram. RSI is in the neutral zone. Bollinger Bands (period 20): neutral, declining volatility.
- The main recommendation: sale entry is started from 1.0000 (MA 100), 1.0050, 1.0050.
- Alternative recommendation: buy entry is started from 0.9970 (MA 200), 0.9950, 0.9930.
The Swiss franc remains under pressure of growing interest in risky assets. But the pair’s growth is also limited by recent highs.
USD JPY (current price: 114.10)
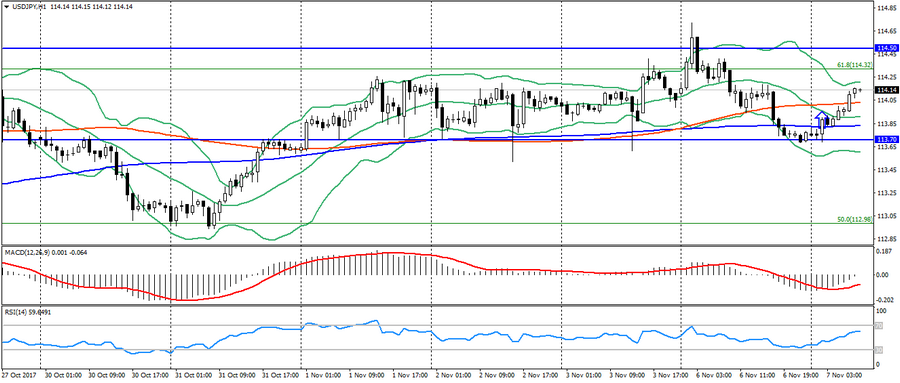
- Support levels: 108.90, 108.10 (April 2017 minimum), 107.30 (2017 minimum).
- Resistance levels: 113.70, 114.50 (July 2017 maximum), 115.00.
- Computer analysis: MACD (signal – upward motion): the indicator is below 0, the signal line is in the body of the histogram. RSI is in the neutral zone. Bollinger Bands (period 20): neutral, growing volatility.
- The main recommendation: sale entry is started from 114.00 (MA 100), 114.30 (Fibo. 61.8 from the maximum of December 2016), 115.00.
- Alternative recommendation: buy entry is started from 113.80 (MA 200), 113.50, 113.30.
The Japanese yen also weakened based on the ubiquitous growth of the American and remains trading near significant resistance levels.
USD CAD (current price: 1.2780)
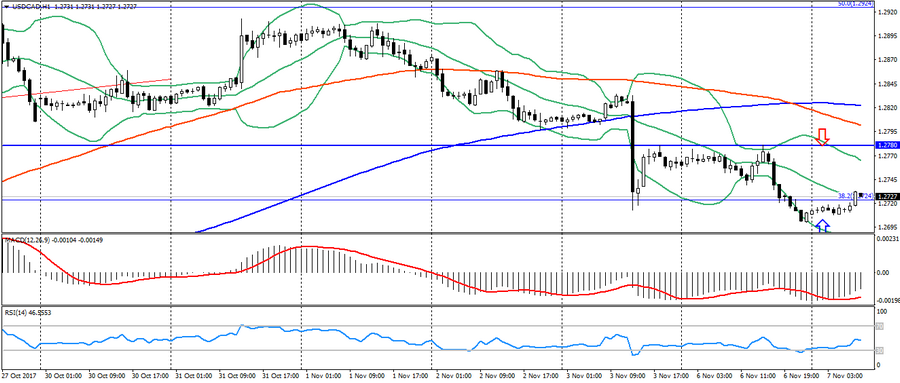
- Support levels: 1.2200, 1.2060 (2017 minimum), 1.1950 (at least 2015).
- Resistance levels: 1.2780 (August 2017 maximum), 1.3000, 1.3160.
- Computer analysis: MACD (signal – upward motion): the indicator is below 0, the signal line has left the body of the histogram. RSI is in the neutral zone. Bollinger Bands (period 20): neutral, declining volatility.
- The main recommendation: sale entry is started from 1.2740, 1.2780, 1.2820 (MA 200).
- Alternative recommendation: buy entry is started from 1.2700, 1.2680, 1.2650.
The Canadian dollar is trading near the highs of the month, but is limited to a noticeable overbought.
AUD USD (current price: 0.7670)
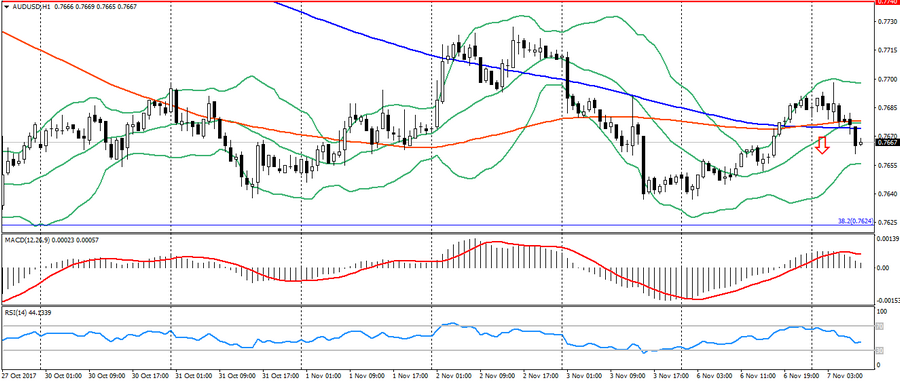
- Support levels: 0.7740, 0.7320 (2017 minimum), 0.7120.
- Resistance levels: 0.8120 (2017 maximum), 0.8200, 0.8290 (2014 maximum).
- Computer analysis: MACD (signal – downward motion): the indicator is higher than 0, the signal line has left the body of the histogram. RSI is in the neutral zone. Bollinger Bands (period 20): oversold, declining volatility.
- The main recommendation: sale entry is started from 0.7690, 0.7720 (MA 200), 0.7740.
- Alternative recommendation: buy entry is started from 0.7670 (MA 200), 0.7650, 0.7630.
The Australian remains under pressure of growth of the American, despite positive signals from the RBA.
NZD USD (current price: 0.6920)
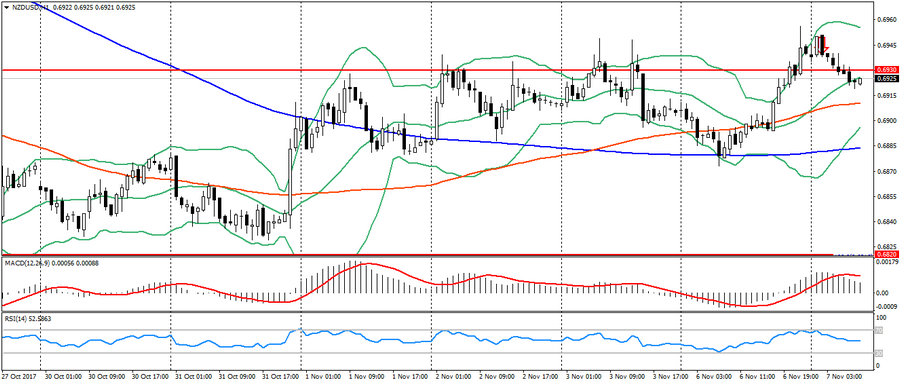
- Support levels: 0.7000, 0.6930, 0.6820 (the minimum of the current year).
- Resistance levels: 0.7380, 0.7450, 0.7550 (2017 maximum).
- Computer analysis: MACD (signal – downward motion): the indicator is higher than 0, the signal line has left the body of the histogram. RSI is in the neutral zone. Bollinger Bands (period 20): neutral, declining volatility.
- The main recommendation: sale entry is started from of 0.6930, 0.6950, 0.6970 (Fibo. 78.6 from the May low).
- Alternative recommendation: buy entry is started from 0.6900 (MA 100), 0.6880 (MA 200), 0.6860.
The New Zealand dollar is also trading lower against the rising of the US dollar pressure, but so far it is limited by an uptrend.
XAU USD (current price: 1278.00)
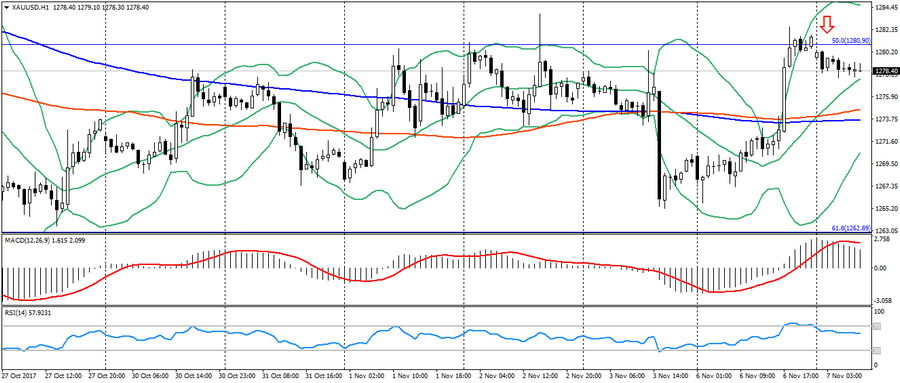
- Support levels: 1250.00, 1226.00, 1200.00.
- Resistance levels: 1340.00, 1355.00, 1374.00 (2016 maximum).
- Computer analysis: MACD (signal – downward motion): the indicator is higher than 0, the signal line has left the body of the histogram. RSI is in the neutral zone. Bollinger Bands (period 20): neutral, declining volatility.
- The main recommendation: sale entry is started from 1280.00 (Fibo. 50.0 from the July low), 1283.00 (MA200), 1287.00.
- Alternative recommendation: buy entry is started from 1274.00 (MA 200), 1270.00 (Fibo. 61.8 from the low of July), 1266.00.
Gold remains under the pressure of a downtrend, but continues trading in flat zone.