
Technical analysis of currency pairs (Anton Hanzenko)
EUR USD (current price: 1.1640)
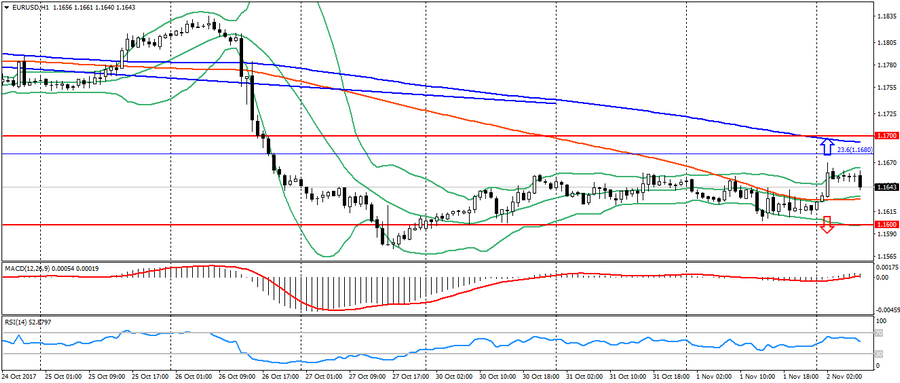
- Support levels: 1.1700 (August 2015 maximum), 1.1600 (2016 maximum), 1.1470.
- Resistance levels: 1.2000, 1.2100, 1.2270 (November 2014 minimum).
- Computer analysis: MACD (signal-flat): the indicator is near 0. RSI is in the neutral zone. Bollinger Bands (period 20): neutral, growing volatility.
- The main recommendation: sale entry is started from 1.1680 (Fibo. 23.6 from December 2016), 1.1700 (strong psychology), 1.1740.
- Alternative recommendation: buy entry is started from 1.1630 (MA 100), 1.1600 (strong psychology), 1.1580.
The EUR/USD remains in the sideways trend, trading below the key resistance 1.1680. The dynamics of the market and the American in general remains very restrained because of the uncertainty in the US and the anticipation of upcoming news.
GBP USD (current price: 1.3250)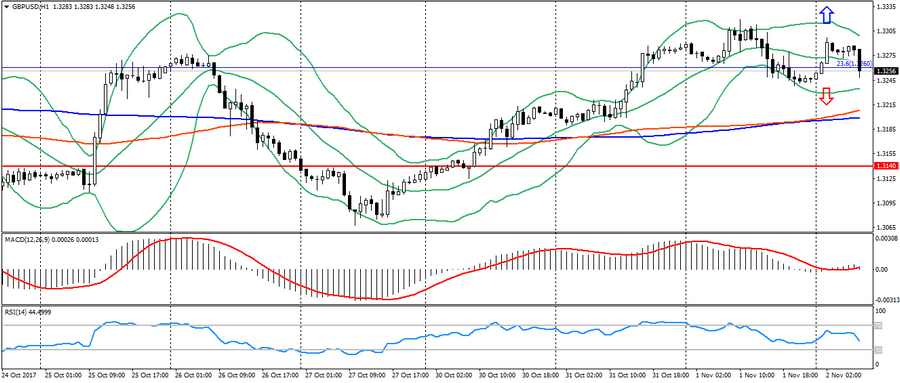
- Support levels: 1.3140, 1.2900, 1.2740 (August 2017 minimum).
- Resistance levels: 1.3500, 1.3660, 1.3830 (February 2016 minimum).
- Computer analysis: MACD (signal – downward motion): the indicator is higher than 0, the signal line has left the body of the histogram. RSI in the neutral zone. Bollinger Bands (period 20): neutral, declining volatility.
- The main recommendation: the entry for sale is from 1.3290 (MA 200 to H4), 1.3330 (October high), 1.3350.
- Alternative recommendation: the entrance to the purchase is from 1.3240, 1.3200 (MA 200), 1.3180.
The British pound remains in the consolidation zone before the publication of data on the Bank of England, which will be released today.
USD CHF (current price: 0.9990)
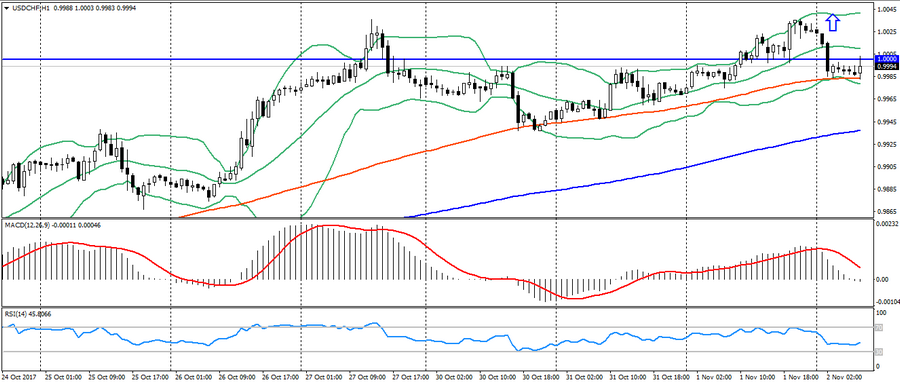
- Support levels: 0.9700, 0.9600, 0.9530.
- Resistance levels: 1.0000, 1.0050, 1.0100 (May maximum).
- Computer analysis: MACD (signal – downward motion): the indicator is higher than 0, the signal line has left the body of the histogram. RSI is in the neutral zone. Bollinger Bands (period 20): neutral, growing volatility.
- The main recommendation: sale entry is started from 1.0030, 1.0050, 1.0080.
- Alternative recommendation: buy entry is started from 0.9980 (MA 100), 0.9950, 0.9930 (MA 200).
The Swiss franc, like the euro, remains in a sideways trend, after rising at the beginning of the day on the weakness of the American. But the overall upward trend persists in the pair.
USD JPY (current price: 114.00)
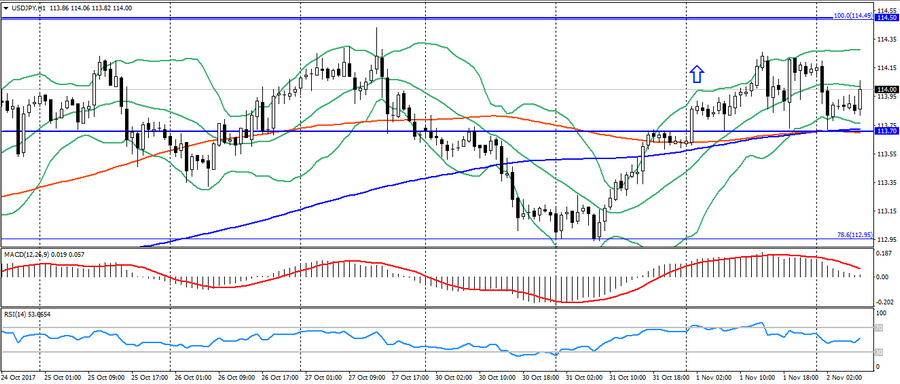
- Support levels: 108.90, 108.10 (April 2017 minimum), 107.30 (2017 minimum).
- Resistance levels: 113.70, 114.50 (July 2017 maximum), 115.00.
- Computer analysis: MACD (signal – downward motion): the indicator is higher than 0, the signal line has left the body of the histogram. RSI is in the neutral zone. Bollinger Bands (period 20): neutral, growing volatility.
- The main recommendation: sale entry is started from 114.00, 114.30, 114.50 (July maximum).
- Alternative recommendation: buy entry is started from 113.70 (MA 200), 113.50, 113.30 (Fibo. 78.6 from the July maximum).
The Japanese yen moved to consolidation after the decline and demonstrates multidirectional trade. This is caused by the uncertainty of the market over important US data.
USD CAD (current price: 1.2830)
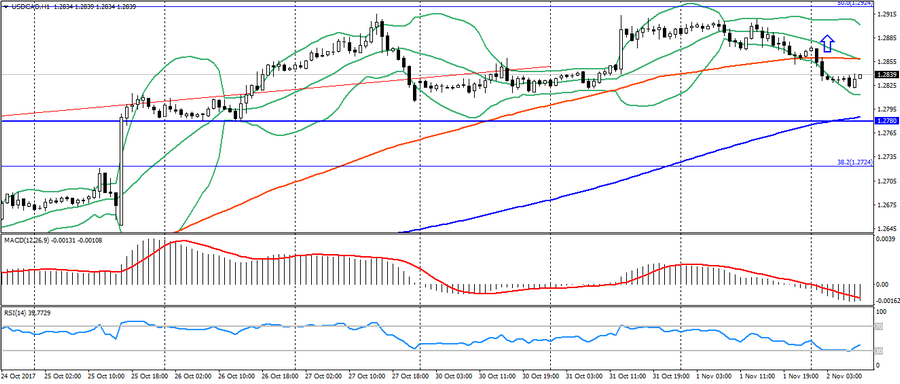
- Support levels: 1.2200, 1.2060 (2017 minimum), 1.1950 (2015 minimum).
- Resistance levels: 1.2780 (August 2017 maximum), 1.3000, 1.3160.
- Computer analysis: MACD (signal – downward motion): the indicator is below 0, the signal line in the body of the histogram. RSI is in the oversold zone. Bollinger Bands (period 20): neutral, declining volatility.
- The main recommendation: sale entry is started from 1.2860 (MA 100), 1.2910, 1.2930 (Fibo.50.0 from the May maximum).
- Alternative recommendation: buy entry is started from 1.2800, 1.2780 (MA 200), 1.2750.
The Canadian dollar is trading in flat after rising at the beginning of the day, remaining in an uptrend.
AUD USD (current price: 0.7700)
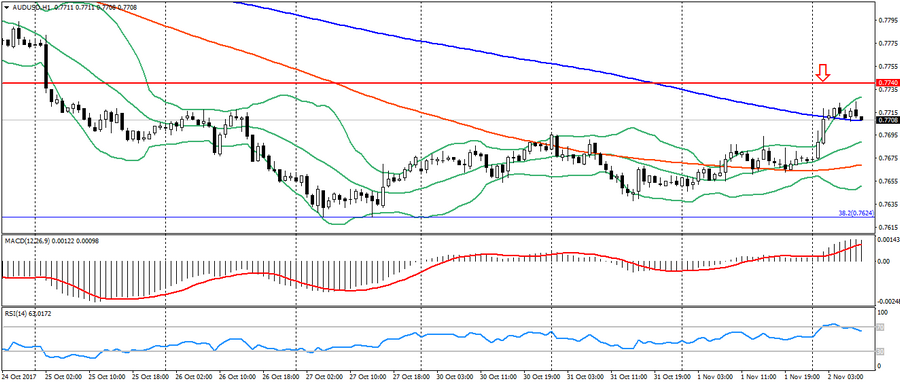
- Support levels: 0.7740, 0.7320 (2017 minimum), 0.7120.
- Resistance levels: 0.8120 (2017 maximum), 0.8200, 0.8290 (2014 maximum).
- Computer analysis: MACD (signal – upward motion): the indicator is above 0, the signal line is in the body of the histogram. RSI is in the neutral zone. Bollinger Bands (period 20): neutral, declining volatility.
- The main recommendation: sale entry is started from 0.7720, 0.7740, 0.7760.
- Alternative recommendation: buy entry is started from 0.7680, 0.7660 (MA 100), 0.7630.
The Australian significantly strengthened early in the day on American weakness and positive data on Australia. Despite this fact, continues to be limited to a downtrend and resistance of 0.7740-50.
NZD USD (current price: 0.6910)
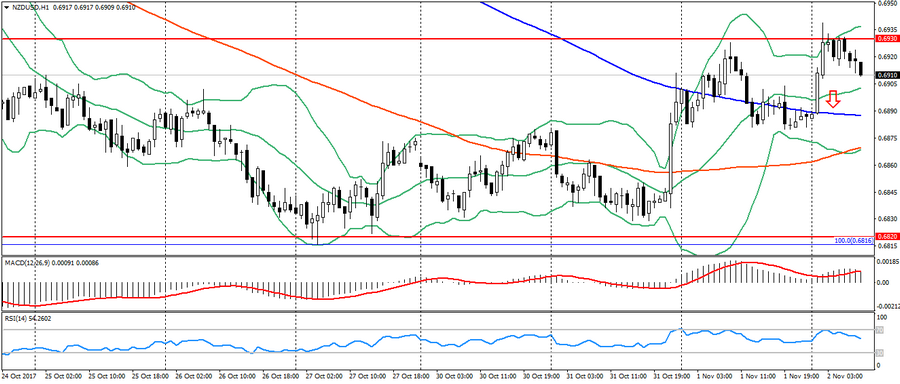
- Support levels: 0.7000, 0.6930, 0.6820 (the minimum of the current year).
- Resistance levels: 0.7380, 0.7450, 0.7550 (2017 maximum).
- Computer analysis: MACD (signal – upward motion): the indicator is above 0, the signal line is in the body of the histogram. RSI is in the neutral zone. Bollinger Bands (period 20): neutral, declining volatility.
- The main recommendation: sale entry is started from 0.6930, 0.6950, 0.6980 (Fibo. 78.6 from the April’s low).
- Alternative recommendation: buy entry is started from 0.6900, 0.6880 (MA 200), 0.6860 (MA 100).
The New Zealand dollar also strengthened at the beginning of the day, but, due to significant overbought, is limited to a maximum of the week.
XAU USD (current price: 1275.00)
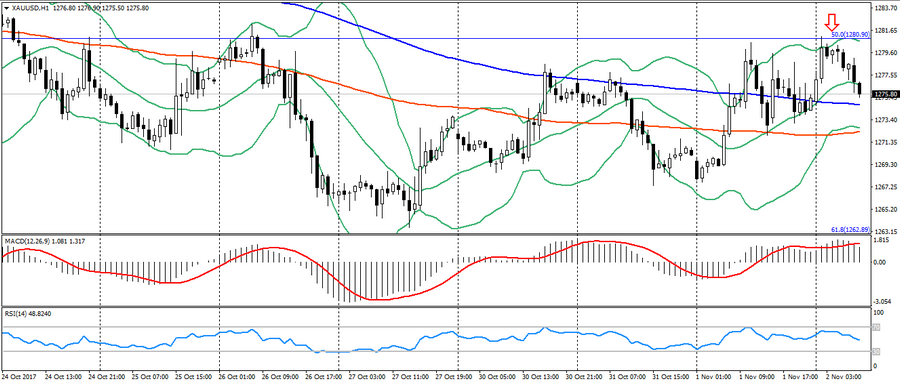
- Support levels: 1250.00, 1226.00, 1200.00.
- Resistance levels: 1340.00, 1355.00, 1374.00 (2016 maximum).
- Computer analysis: MACD (signal – downward motion): the indicator is higher than 0, the signal line has left the body of the histogram. RSI is in the neutral zone. Bollinger Bands (period 20): neutral, declining volatility.
- The main recommendation: sale entry is started from 1279.00, 1281.00 (Fibo. 50.0 from the low of July), 1283.00.
- Alternative recommendation: buy entry is started from 1275.00 (MA 200), 1272.00 (MA 100), 1268.00.
Gold remains under pressure of correction after growth at the beginning of the day, but the overall dynamics of the market remains ambiguous due to the upcoming news.