
Technical analysis of currency pairs (Anton Hanzenko)
EUR USD (current price: 1.1650)
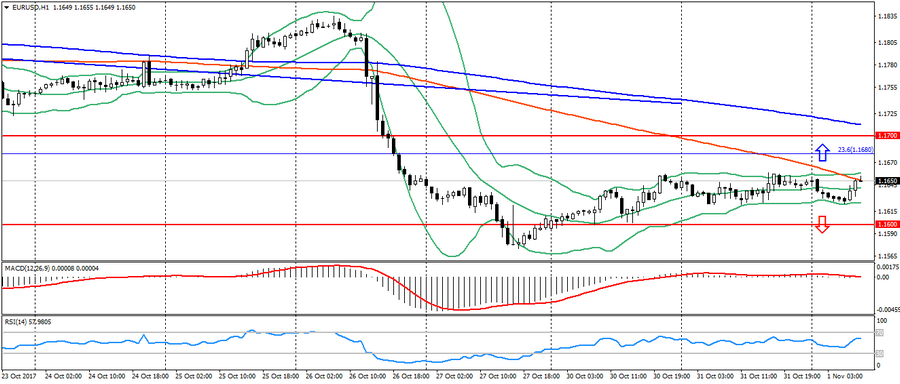
- Support levels: 1.1700 (August 2015 maximum), 1.1600 (2016 maximum), 1.1470.
- Resistance levels: 1.2000, 1.2100, 1.2270 (November 2014 minimum).
- Computer analysis: MACD (signal-flat): the indicator is near 0. RSI is in the neutral zone. Bollinger Bands (period 20): neutral, declining volatility.
- The main recommendation: sale entry is started from 1.1660, 1.1680 (Fibo. 23.6 from December 2016), 1.1700 (strong psychology).
- Alternative recommendation: buy entry is started from 1.1600 (strong psychology), 1.1570, 1.1550.
The pair EUR/USD remains in a sideways trend in anticipation of data on the US Federal Reserve. But, it postpones the fulfillment of expectations for the pair that remain unchanged.
GBP USD (current price: 1.3300)
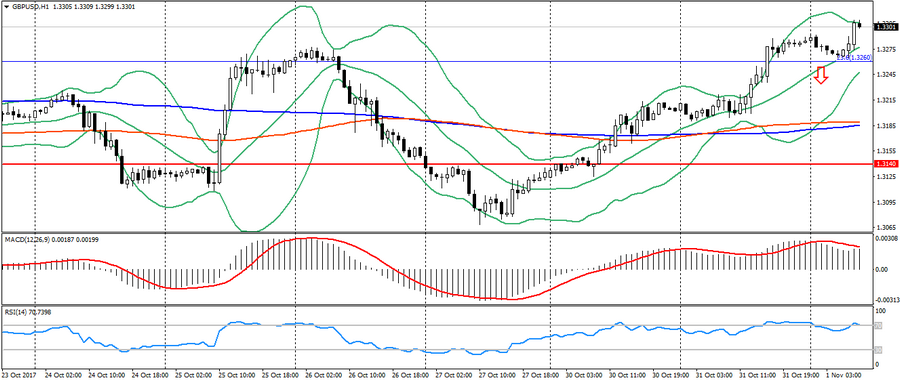
- Support levels: 1.3140, 1.2900, 1.2740 (August 2017 minimum).
- Resistance levels: 1.3500, 1.3660, 1.3830 (February 2016 minimum).
- Computer analysis: MACD (signal – downward motion): the indicator is higher than 0, the signal line has left the body of the histogram. RSI is in the overbought zone. Bollinger Bands (period 20): neutral, declining volatility.
- The main recommendation: sale entry is started from 1.3290 (MA 200 on H4), 1.3330 (October maximum), 1.3350.
- Alternative recommendation: buy entry is started from 1.3260 (Fibo. 23.6 from the January’s low), 1.3230, 1.3180 (MA 200).
Alternative expectations on the pound for Tuesday were justified; the profit could amount to 70 points. After a long two-day uptrend, the GBP/USD pair approached the significant resistance levels that meet the highs of the previous month. Therefore, the possibility of correction has significantly increased.
USD CHF (current price: 0.9990)
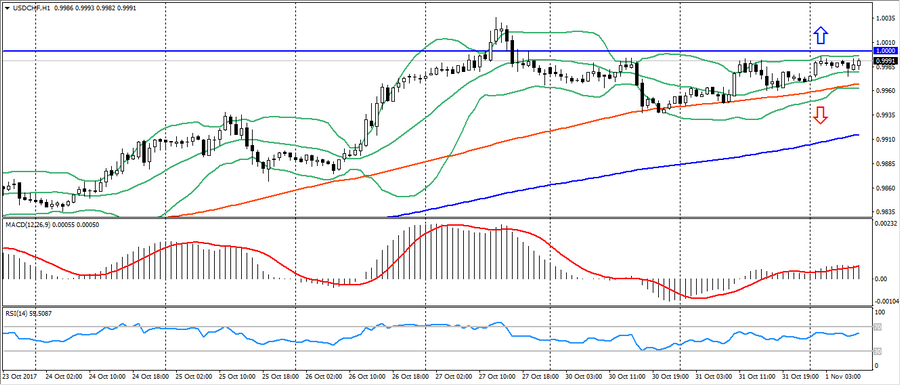
- Support levels: 0.9700, 0.9600, 0.9530.
- Resistance levels: 1.0000, 1.0050, 1.0100 (May maximum).
- Computer analysis: MACD (signal – upward motion): the indicator is above 0, the signal line is in the body of the histogram. RSI is in the neutral zone. Bollinger Bands (period 20): neutral, low volatility.
- The main recommendation: sale entry is started from 1.0000 (strong psychology), 1.0030, 1.0050.
- Alternative recommendation: buy entry is started from 0.9960 (MA 100), 0.9930, 0.9910 (MA 200).
The Swiss franc, like the euro, remains in the sideways trend, limiting itself to significant resistance.
USD JPY (current price: 113.90)
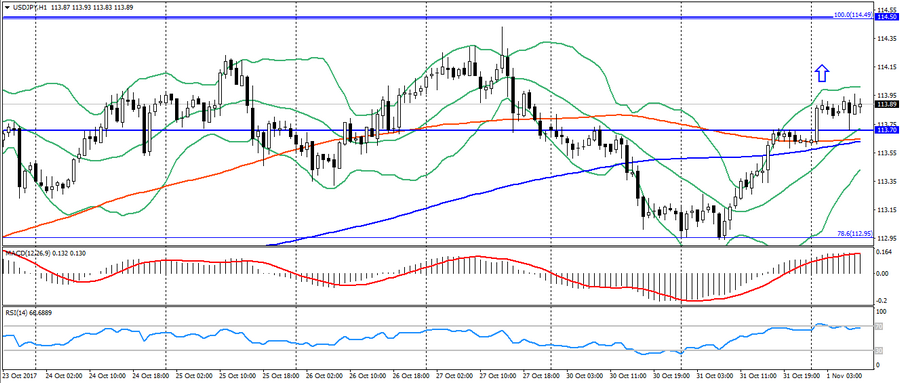
- Support levels: 108.90, 108.10 (April 2017 minimum), 107.30 (2017 minimum).
- Resistance levels: 113.70, 114.50 (July 2017 maximum), 115.00.
- Computer analysis: MACD (signal – upward motion): the indicator is above 0, the signal line is in the body of the histogram. RSI is in the overbought zone. Bollinger Bands (period 20): neutral, declining volatility.
- The main recommendation: sale entry is started from 114.00 (MA 200), 114.20, 114.50 (July maximum).
- Alternative recommendation: buy entry is started from 113.60 (MA 200), 113.40, 112.90 (Fibo. 78.6 from the July high).
The Japanese yen fully justified the forecast on correction. As a result, the profit could amount to 70 points. The return of investors was caused by the correction before the publication of the US Federal Reserve Protocol, which will be today. Therefore, before the release of data on the US, one should expect the maintenance of the upward dynamics.
USD CAD (current price: 1.2890)
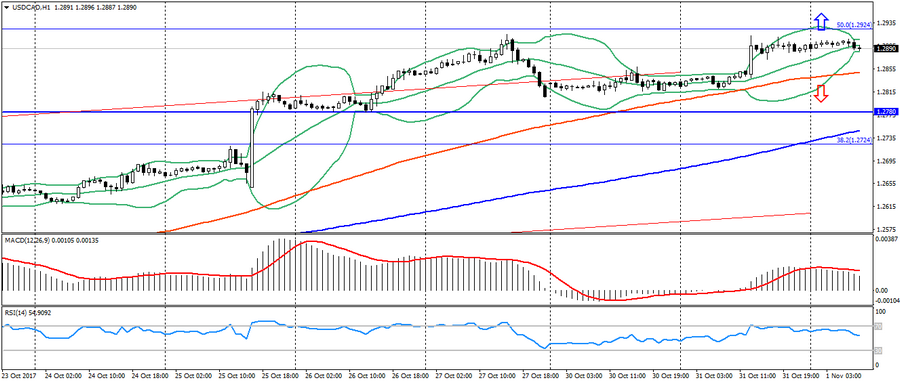
- Support levels: 1.2200, 1.2060 (2017 minimum), 1.1950 (2015 minimum).
- Resistance levels: 1.2780 (August 2017 maximum), 1.3000, 1.3160.
- Computer analysis: MACD (signal – downward motion): the indicator is higher than 0, the signal line has left the body of the histogram. RSI is in the neutral zone. Bollinger Bands (period 20): neutral, low volatility.
- The main recommendation: sale entry is started from 1.2900, 1.2930 (Fibo. 50.0 from the May maximum), 1.2950.
- Alternative recommendation: buy entry is started from 1.2850 (MA 100), 1.2810, 1.2780.
The Canadian dollar appreciably weakened on yesterday’s data on Canada and brought up to 50 points of profit. But, after growth, the pair USD/CAD remains clamped in a sideways trend, which is caused by a correction.
AUD USD (current price: 0.7670)
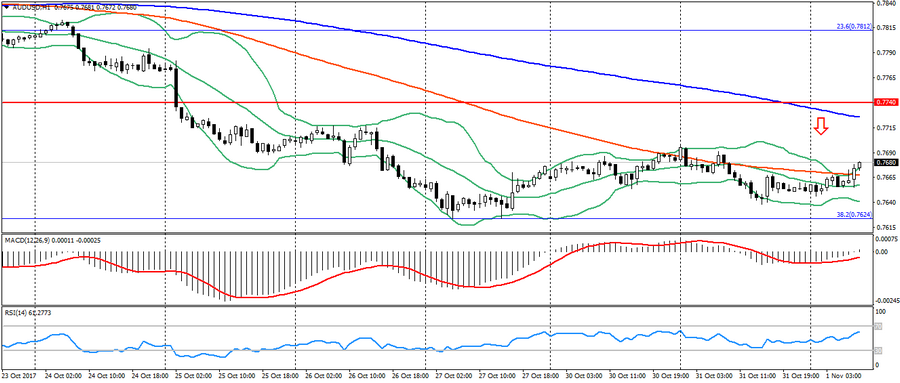
- Support levels: 0.7740, 0.7320 (2017 minimum), 0.7120.
- Resistance levels: 0.8120 (2017 maximum), 0.8200, 0.8290 (2014 maximum).
- Computer analysis: MACD (signal – upward motion): the indicator is below 0, the signal line has left the body of the histogram. RSI is in the neutral zone. Bollinger Bands (period 20): neutral, growing volatility.
- The main recommendation: sale entry is started from 0.7690, 0.7720 (MA 200), 0.7740.
- Alternative recommendation: buy entry is started from 0.7640, 0.7620 (Fibo, 38.2 from the low of January 2016), 0.7570 (July minimum).
Expectations for the weakening of the Australian were justified (up to 40 points), but it is too early to talk about the development of a full-fledged downward trend. It should be noted that the potential for a decline remains in this pair.
NZD USD (current price: 0.6920)
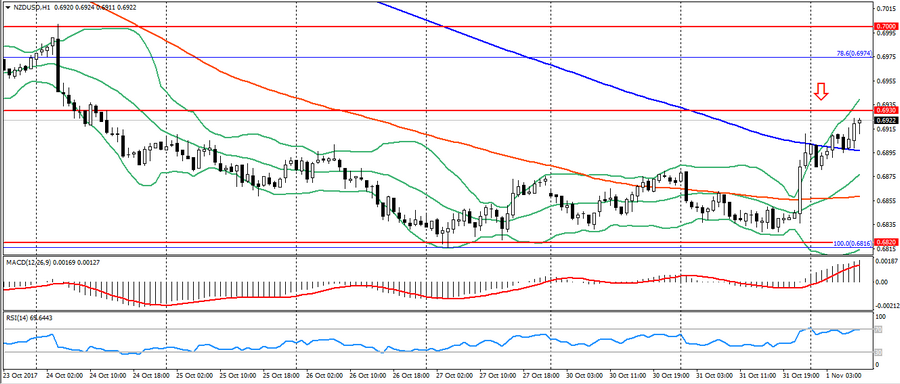
- Support levels: 0.7000, 0.6930, 0.6820 (the minimum of the current year).
- Resistance levels: 0.7380, 0.7450, 0.7550 (2017 maximum).
- Computer analysis: MACD (signal – upward motion): the indicator is above 0, the signal line is in the body of the histogram. RSI is in the overbought zone. Bollinger Bands (period 20): neutral, growing volatility.
- The main recommendation: sale entry is started from of 0.6910, 0.6930, 0.6950.
- Alternative recommendation: buy entry is started from 0.6860 (MA 100), 0.6840, 0.6820 (minimum of the current year).
The New Zealand dollar, as expected, declined throughout the day and could bring up to 30 points. But data on employment in New Zealand forced the pair to strengthen significantly. As a result, it is limited to the level of 0.6930-50 and it is possible to repel.
XAU USD (current price: 1275.00)
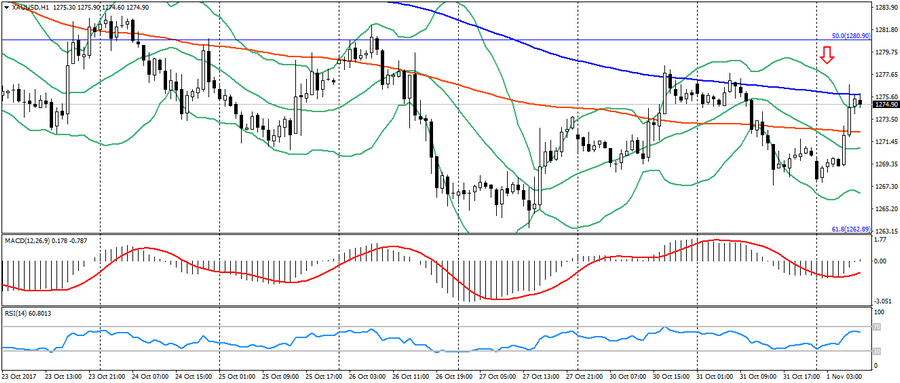
- Support levels: 1250.00, 1226.00, 1200.00.
- Resistance levels: 1340.00, 1355.00, 1374.00 (2016 maximum).
- Computer analysis: MACD (signal – upward motion): the indicator is below 0, the signal line has left the body of the histogram. RSI is in the neutral zone. Bollinger Bands (period 20): overbought, growing volatility.
- The main recommendation: sale entry is started from 1276.00 (MA 200), 1281.00 (Fibo.50.0 from the July’s low), 1283.00.
- Alternative recommendation: buy entry is started from 1269.00, 1265.00, 1262.00 (Fibo. 61.8 from the July’s low).
Expectations on the gold reduce were justified (up to 700 points). At the beginning of the day, gold managed to recover on the uncertainty of the market, but the potential for decline remains.