
Technical Analysis of Oil (Alexander Sivtsov)
Oil is traded near zero marks during the Asian session.
The Brent graph (current price: $ 6264.10 per 100 barrels)

The Brent brand is traded with a small plus during the Asian session.
- Resistance 1: From $ 6450.70 (February 9 maximum)
- Resistance 2: From $ 6546.80 (February 8 maximum)
- Support 1: From $ 6165.10 (February 13 minimum)
- Support 2: From $ 6100.00 (psychological level)
Computer analysis: The Stochastic Oscillator movings on the H4 chart are in the neutral zone, against which the continuation of the consolidation of the Brent price may be possible.
The WTI graph (current price: $ 5901.90 per 100 barrels)
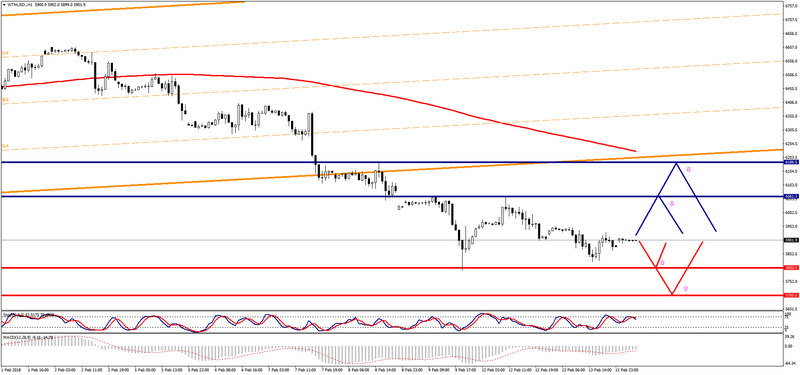
The WTI brand is traded near the zero mark during the Asian session.
- Resistance 1: From $ 6061.30 (February 9 maximum)
- Resistance 2: From $ 6186.50 (February 8 maximum)
- Support 1: From $ 5800.00 (psychological level)
- Support 2: From $ 5700.00 (psychological level)
Computer analysis: The Stochastic Oscillator movings on the H4 chart are in the neutral zone, and therefore one should expect the continuation of WTI price consolidation in anticipation of data on oil reserves in the US.