
Technical Analysis of Oil (Alexander Sivtsov)
Oil is declining during the Asian session.
The Brent graph (current price: $ 6789.00 per 100 barrels)
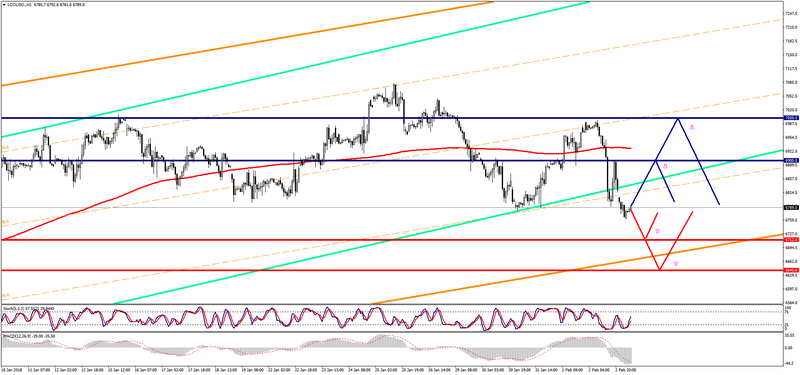
The Brent is traded with a minus during the Asian session.
- Resistance 1: From $ 6900.00 (psychological level)
- Resistance 2: From $ 7000.00 (psychological level)
- Support 1: From $ 6712.10 (January 5 minimum)
- Support 2: From $ 6640.00 (technical level)
Computer analysis: The Stochastic Oscillator movings on the chart of H4 indicate the oversold of the instrument, the recovery of the Brent price.
The WTI graph (current price: $ 6463.40 per 100 barrels)

The WTI brand is traded below the zero mark during the Asian session.
- Resistance 1: From $ 6606.70 (February 2 maximum)
- Resistance 2: From $ 6656.00 (January 25 maximum)
- Support 1: From $ 6,371.70 (January 31 minimum)
- Support 2: From $ 6300.00 (psychological level)
Computer analysis: The Stochastic Oscillator movings on the chart of H4 indicate the oversold of the instrument, the increase in the price of WTI is expected.