
Technical Analysis of Oil (Alexander Sivtsov)
Oil is trading near zero marks during the Asian session.
The Brent graph (current price: $ 6230.20 per 100 barrels)
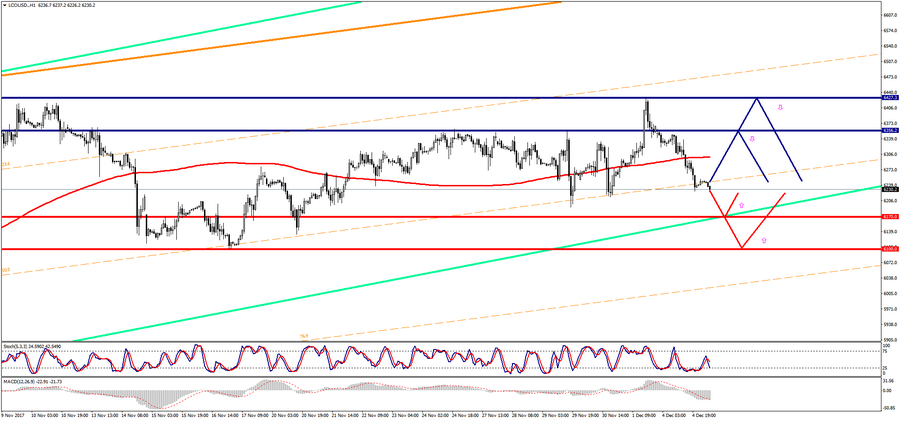
The Brent brand is trading just below the zero mark during the Asian session.
- Resistance 1: From $ 6356.20 (November 29 maximum)
- Resistance 2: From $ 6427.30 (December 1 maximum)
- Support 1: With $ 6170.00 (support line Up channel on H1)
- Support 2: From $ 6100.00 (psychological level)
Computer analysis: The Stochastic Oscillator movings on the H4 chart indicate oversold of the instrument and there may be some recovery of the Brent price, in anticipation of data on oil reserves in the US by ADP.
The WTI graph (current price: $ 5742.30 per 100 barrels)
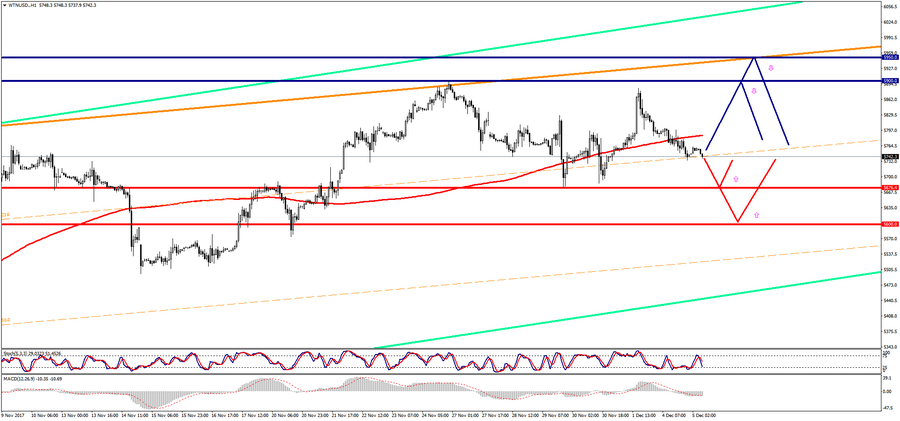
The WTI brand is trading near the zero mark during the Asian session.
- Resistance 1: From $ 5900.00 (psychological level)
- Resistance 2: From $ 5950.00 (resistance line Up channel on H4)
- Support 1: From $ 5676.40 (November 29 minimum)
- Support 2: From $ 5600.00 (psychological level)
Computer analysis: The Stochastic Oscillator movings on the H4 chart indicate oversold of the instrument, which is why the WTI price may rise, in anticipation of data on oil reserves in the US.