
Technical Analysis of Oil (Alexander Sivtsov)
Oil shows mixed dynamics during the Asian session.
The Brent graph (current price: $ 6119.20 per 100 barrels)
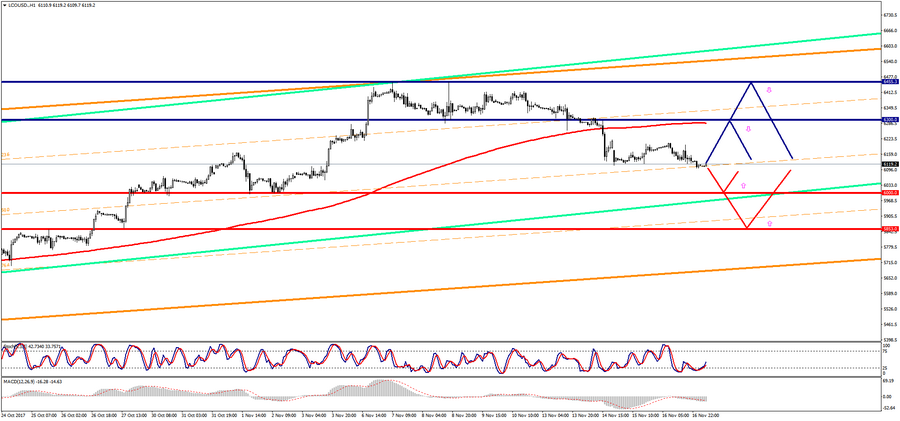
Brent is trading below the zero mark during the Asian session.
- Resistance 1: From $ 6300.00 (psychological level)
- Resistance 2: From $ 6455.30 (November 8 maximum)
- Support 1: From $ 6000.00 (psychological level)
- Support 2: From $ 5853.00 (October 25 maximum)
Computer analysis: Stochastic Oscillator movings on H4 chart are part of the oversold zone, one should expect some recovery of the Brent price in the second half of the day.
The WTI graph (current price: $ 5550.60 per 100 barrels)
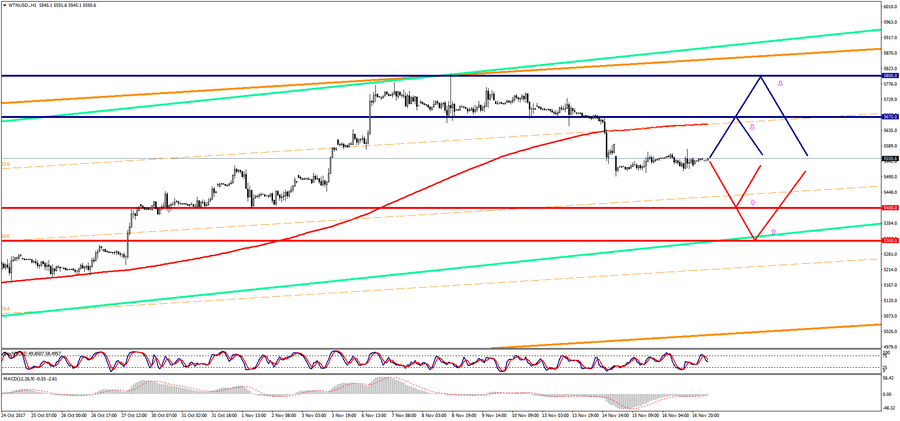
The WTI is trading with a small plus during the Asian session.
- Resistance 1: From $ 5675.00 (technical level)
- Resistance 2: From $ 5800.00 (psychological level)
- Support 1: From $ 5400.00 (psychological level)
- Support 2: From $ 5300.00 (psychological level)
Computer analysis: Stochastic Oscillator movings on H4 chart are in the neutral zone, so that the consolidation of the price of WTI oil may be continued.