
Technical Analysis of Oil (Alexander Sivtsov)
Oil is trading below the zero mark in the Asian session.
The Brent graph (current price: $ 6131.20 per 100 barrels)
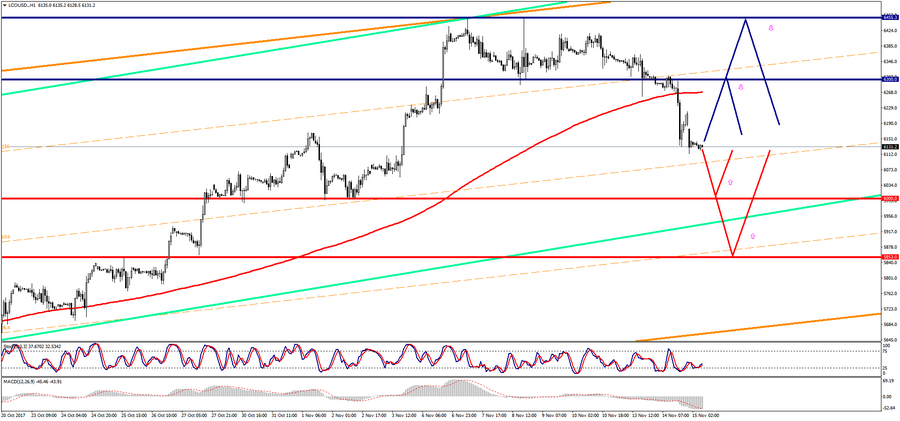
Brand Brent is trading below the zero mark during the Asian session.
- Resistance 1: From $ 6300.00 (psychological level)
- Resistance 2: From $ 6455.30 (November 8 maximum)
- Support 1: From $ 6000.00 (psychological level)
- Support 2: From $ 5853.00 (October 25 maximum)
Computer analysis: The Stochastic Oscillator movings on the H1 chart are in the neutral zone. One should expect consolidation of the Brent price in anticipation of data on oil and oil products in the US.
The WTI graph (current price: $ 5521.40 per 100 barrels)
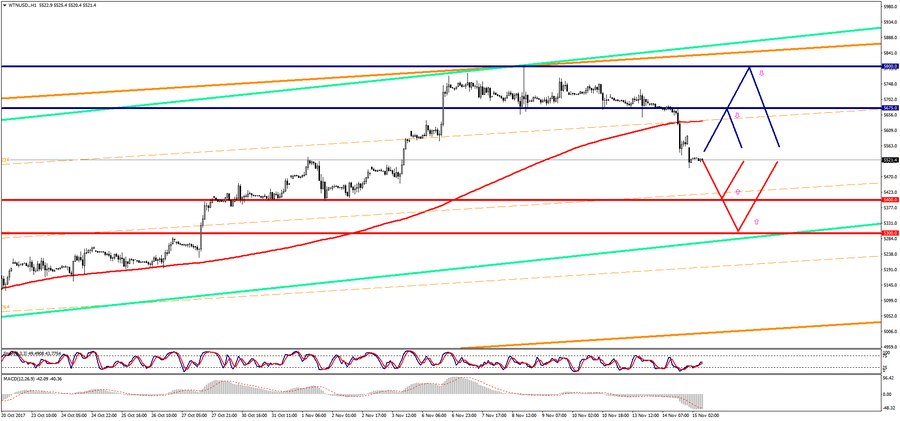
- Resistance 1: From $ 5675.00 (technical level)
- Resistance 2: From $ 5800.00 (psychological level)
- Support 1: From $ 5400.00 (psychological level)
- Support 2: From $ 5300.00 (psychological level)
Computer analysis: The Stochastic Oscillator movings on the H1 chart are in the neutral zone, that is why one should also expect the consolidation of the price of WTI oil.