Technical Analysis of Oil (Alexander Sivtsov)
Oil is trading near zero marks during the Asian session.
The Brent graph (current price: $ 6120.80 per 100 barrels)
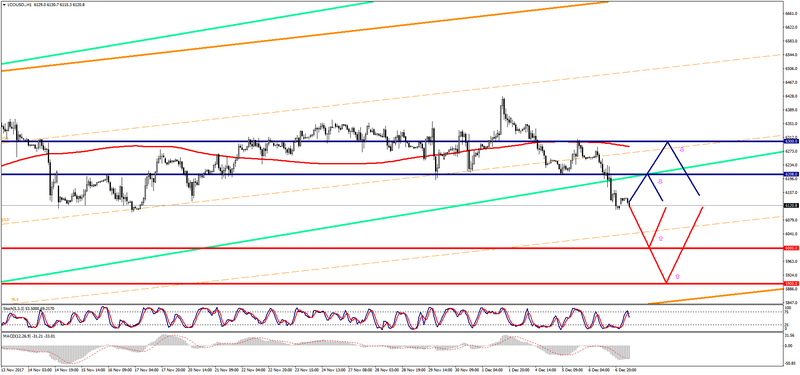
The Brent brand is trading just above the zero mark during the Asian session.
- Resistance 1: From $ 6208.20 (Dec. 5 minimum)
- Resistance 2: From $ 6300.00 (psychological level)
- Support 1: From $ 6000.00 (psychological level)
- Support 2: From $ 5900.00 (psychological level)
It is also worth noting that “double top” figure is formed on the D1 chart on the Brent brand, that is why the price can easily fall to the second support level.
Computer analysis: The Stochastic Oscillator movings on the H4 chart indicate oversold of the instrument. So, there may be some recovery of the Brent price.
The WTI graph (current price: $ 5597.90 per 100 barrels)
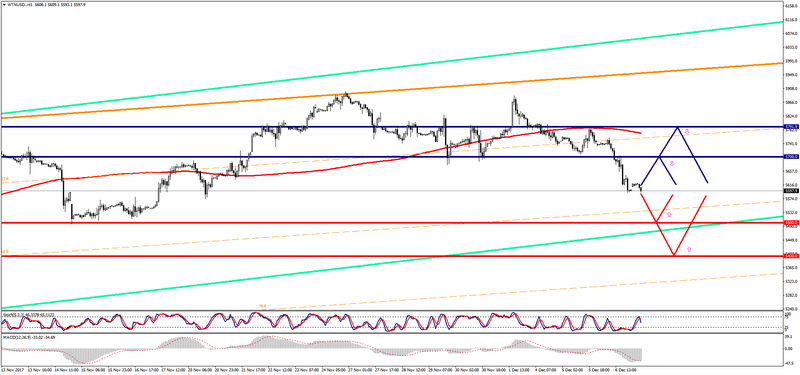
The WTI brand is trading near the zero mark during the Asian session.
- Resistance 1: From $ 5700.00 (psychological level)
- Resistance 2: From $ 5791.90 (December 5 maximum)
- Support 1: From $ 5500.00 (psychological level)
- Support 2: From $ 5400.00 (psychological level)
Computer analysis: The Stochastic Oscillator movings on the H4 chart indicate the oversold of the instrument, which is why the WTI price recovery is possible.