
Technical Analysis of Oil (Alexander Sivtsov)
Oil is trading near zero marks during the Asian session.
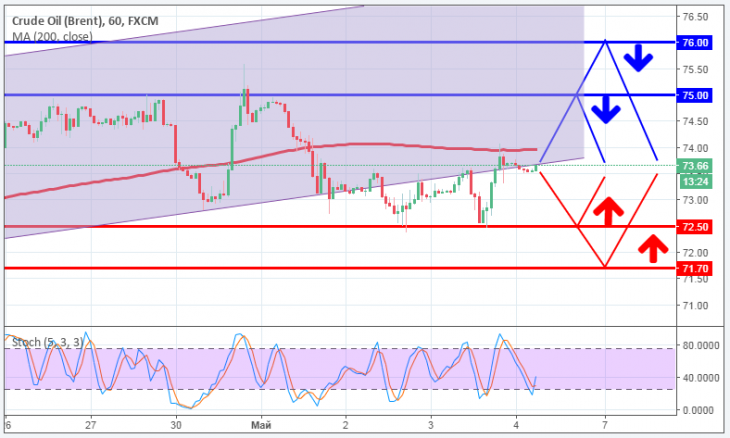
Brent chart (current price: $ 73.66)
The Brent is trading near the zero mark during the Asian session.
- Resistance 1: From $ 75.00 (psychological level)
- Resistance 2: From $ 76.00 (psychological level)
- Support 1: From $ 72.50 (technical level)
- Support 2: From $ 71.70 (technical level)
Computer analysis: The Stochastic Oscillator movings on the H4 chart enter the overbought zone, against which the Brent price may be reduced in the second half of the trades.
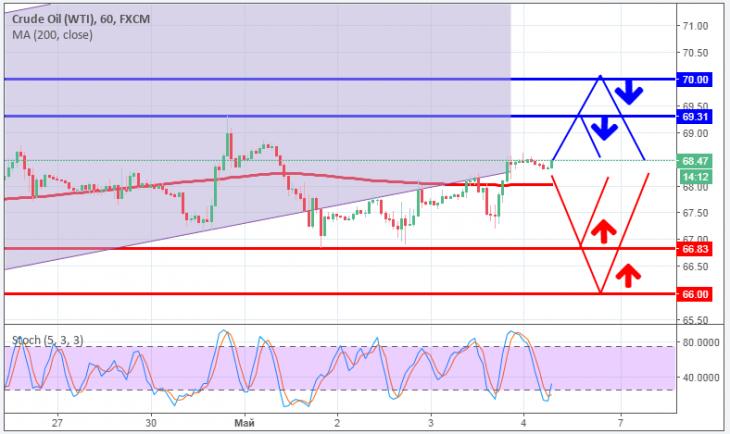
WTI chart(current price: $ 68.47)
The WTI brand is trading in a narrow range during the Asian session.
- Resistance 1: From $ 69.31 (April 30 maximum)
- Resistance 2: From $ 70.00 (psychological level)
- Support 1: From $ 66.83 (April 1 minimum)
- Support 2: From $ 66.00 (psychological level)
Computer analysis: The Stochastic Oscillator movings on the H4 chart indicate overbought of the instrument, in connection with which the reduction of the price of WTI is expected.