
Technical Analysis of Oil (Alexander Sivtsov)
Oil is traded above the zero mark in the Asian session.
The Brent graph (current price: $ 6713.80 per 100 barrels)
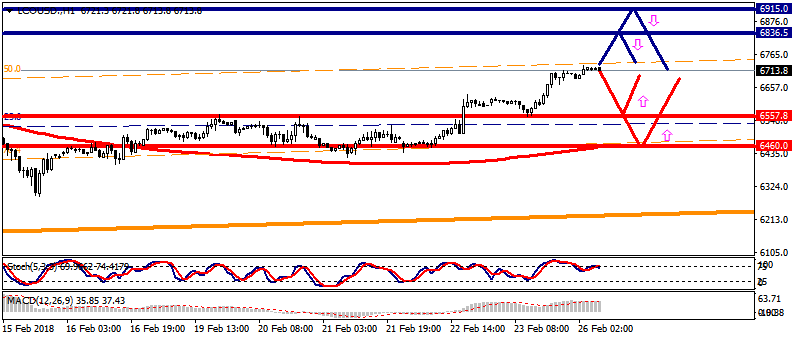
The Brent is traded with a small plus during the Asian session.
- Resistance 1: From $ 6836.50 (February 5 maximum)
- Resistance 2: From $ 6915.00 (technical level)
- Support 1: With $ 6557.80 (February 23 minimum)
- Support 2: From $ 6460.00 (MA 200 on H1)
Computer analysis: The Stochastic Oscillator movings on the chart of H4 indicate overbought of the instrument. Also, “Bear divergence” is formed on the MACD indicator on the chart H1. So, there may be some reduction in the price of Brent.
The WTI graph (current price: $ 6366.40 per 100 barrels)
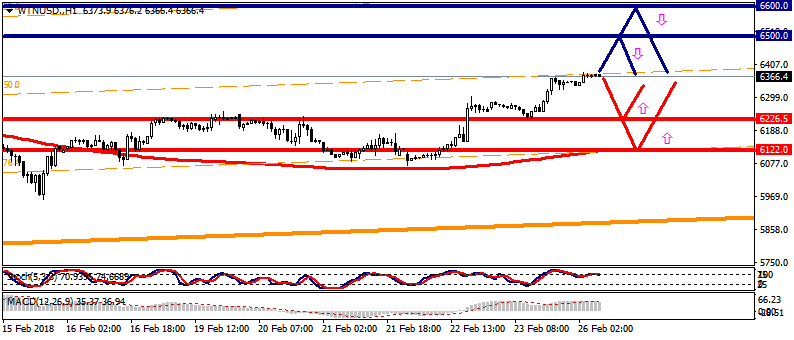
The WTI brand is traded above the zero mark during the Asian session.
- Resistance 1: From $ 6500.00 (psychological level)
- Resistance 2: From $ 6600.00 (psychological level)
- Support 1: From $ 6226.50 (February 23 minimum)
- Support 2: From $ 6122.00 (MA 200 on H1)
Computer analysis: The Stochastic Oscillator movings on the chart of H4 indicate overbought of the instrument. “Bear divergence” is formed on the MACD indicator on the chart H1. So, there may be some reduction in the price of WTI.