
Technical Analysis of Oil (Alexander Sivtsov)
Oil is traded in the green zone during the Asian session.
The Brent graph (current price: $ 6844.60 per 100 barrels)
The Brent brand is traded above the zero mark during the Asian session.
- Resistance 1: From $ 7009.30 (January 15 maximum)
- Resistance 2: From $ 7100.00 (psychological level)
- Support 1: From $ 6700.00 (psychological level)
- Support 2: From $ 6615.10 (January 2 minimum)
Computer analysis: The Stochastic Oscillator movings on the charts of H1 and H4 are in the neutral zone. The consolidation of the Brent price is possible.
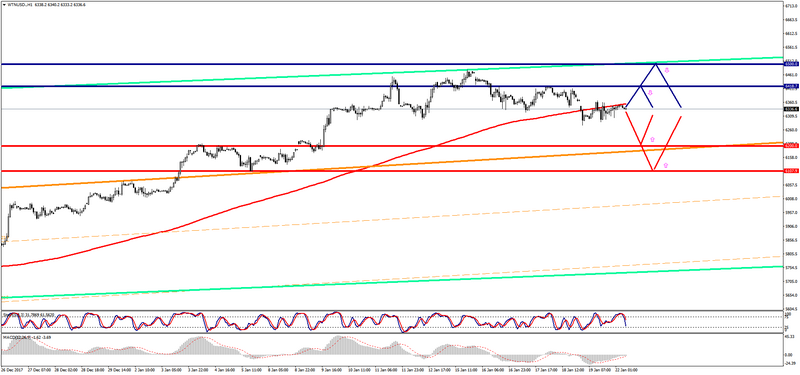
The WTI graph (current price: $ 6336.60 per 100 barrels)
The WTI brand is traded with a small plus during the Asian session.
- Resistance 1: From $ 6418.70 (January 18 maximum)
- Resistance 2: From $ 6500.00 (psychological level)
- Support 1: From $ 6200.00 (psychological level)
- Support 2: From $ 6107.90 (January 5 minimum)
Computer analysis: The Stochastic Oscillator movings on the charts of H1 and H4 are in the neutral zone,therefore one should expect the continuation of the WTI price movement in a narrow range.