
Technical Analysis of Oil (Alexander Sivtsov)
Oil is trading above the zero mark in the Asian session.
The Brent graph (current price: $ 6653.10 per 100 barrels)

The Brent brand is trading above the zero mark during the Asian session.
- Resistance 1: From $ 6700.00 (psychological level)
- Resistance 2: From $ 6800.00 (psychological level)
- Support 1: From $ 6539.90 (December 12 maximum)
- Support 2: From $ 6448.90 (December 26 minimum)
Computer analysis: The Stochastic Oscillator movings on the charts of H1 and D1 indicate the overbought of the instrument, one should expect a downward correction of the Brent price.
The WTI graph (current price: $ 6020.90 per 100 barrels)
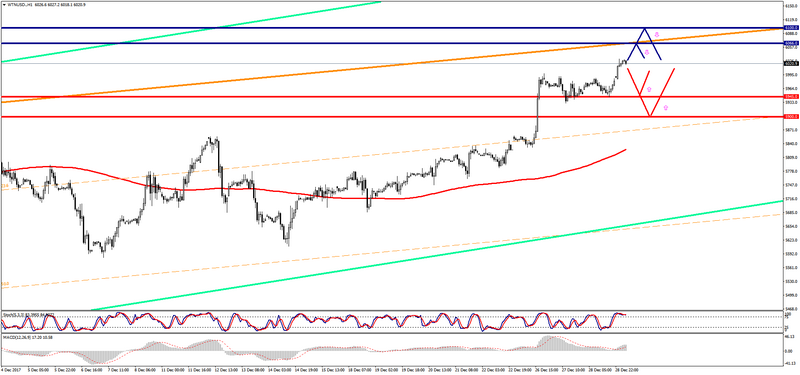
The WTI brand is trading with a plus during the Asian session.
- Resistance 1: From $ 6066.00 (resistance line of the upward channel on H4)
- Resistance 2: From $ 6100.00 (psychological level)
- Support 1: From $ 5945.00 (December 28 minimum)
- Support 2: From $ 5900.00 (psychological level)
Computer analysis: The Stochastic Oscillator movings on the charts of H1 and D1 indicate the overbought of the instrument, in connection with which a downward correction of the WTI price is possible.