
Technical Analysis of Oil (Alexander Sivtsov)
Oil is trading below the zero mark in the Asian session.
The Brent graph (current price: $ 6611.10 per 100 barrels)
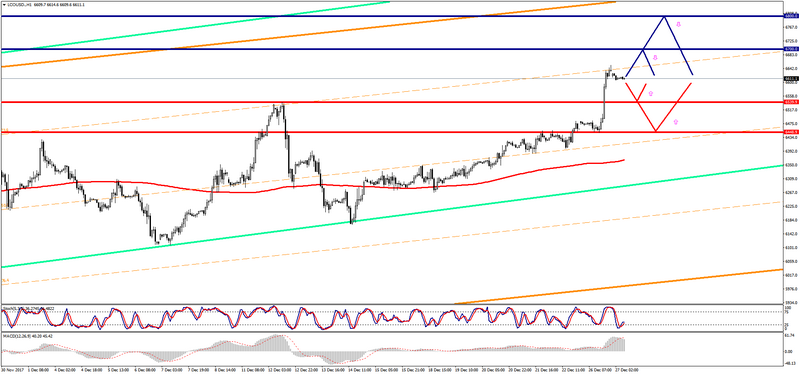
The Brent is trading below the zero mark during the Asian session.
- Resistance 1: From $ 6700.00 (psychological level)
- Resistance 2: From $ 6800.00 (psychological level)
- Support 1: From $ 6539.90 (December 12 maximum)
- Support 2: From $ 6448.90 (December 26 minimum)
Computer analysis: The Stochastic Oscillator movings on the charts of H4 and D1 indicate overbought of the instrument, one should expect the continuation of the downward correction of the Brent price.
The WTI graph (current price: $ 5971.40 per 100 barrels)
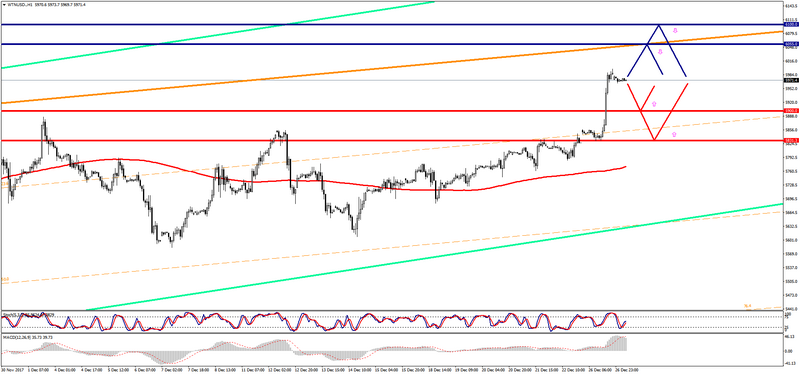
The WTI brand is trading with a small plus during the Asian session.
- Resistance 1: From $ 6055.00 (resistance line of Up Channel on H4)
- Resistance 2: From $ 6100.00 (psychological level)
- Support 1: From $ 5900.00 (psychological level)
- Support 2: With $ 5,831.30 (December 26 minimum)
Computer analysis: The Stochastic Oscillator movings on the charts of H4 and D1 indicate overbought of the instrument, which is why the downward correction of the WTI price is possible.