
Technical Analysis of Oil (Alexander Sivtsov)
Oil is trading below the zero mark in the Asian session.
The Brent graph (current price: $ 6443.00 per 100 barrels)
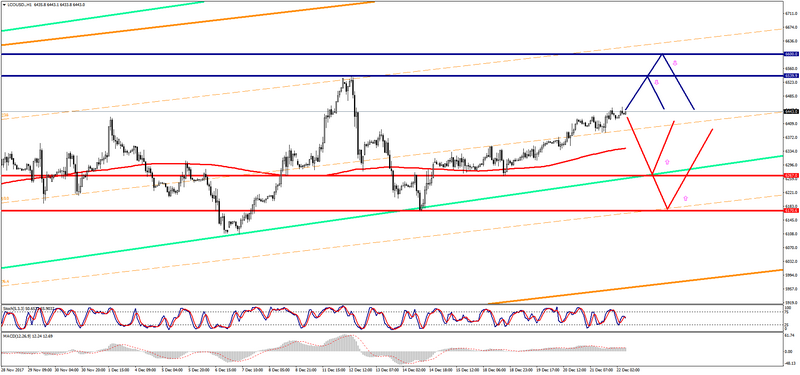
The Brent is trading just below the zero mark during the Asian session.
- Resistance 1: From $ 6539.90 (December 12 maximum)
- Resistance 2: From $ 6600.00 (psychological level)
- Support 1: From $ 6267.00 (December 18 minimum)
- Support 2: From $ 6170.60 (December 14 minimum)
Computer analysis: The Stochastic Oscillator movings on the D1 chart indicate overbought of the instrument, one should expect a certain reduction in Brent price.
The WTI graph (current price: $ 5818.20 per 100 barrels)
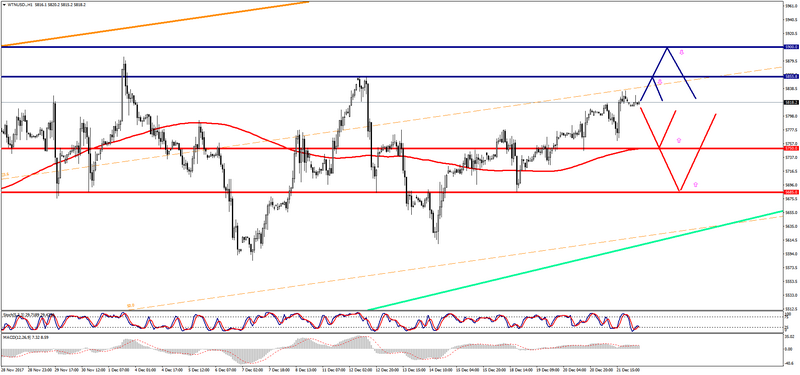
The WTI brand is trading with a minus during the Asian session.
- Resistance 1: From $ 5855.80 (December 12 maximum)
- Resistance 2: From $ 5900.00 (psychological level)
- Support 1: From $ 5750.00 (MA 200 on H1)
- Support 2: From $ 5685.00 (December 12 minimum)
Computer analysis: The Stochastic Oscillator movings on the D1 chart indicate overbought of the instrument, which may lead to some reduction in the WTI price.