
Technical Analysis of Oil (Alexander Sivtsov)
Oil is trading near zero marks during the Asian session.
The Brent graph (current price: $ 6193.30 per 100 barrels)
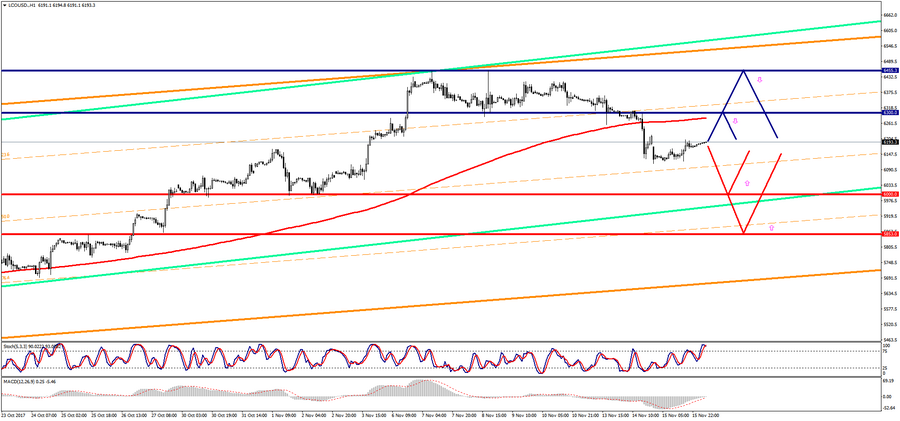
Brent is trading above the zero mark during the Asian session.
- Resistance 1: From $ 6300.00 (psychological level)
- Resistance 2: From $ 6455.30 (November 8 maximum)
- Support 1: From $ 6000.00 (psychological level)
- Support 2: From $ 5853.00 (October 25 maximum)
Computer analysis: The Stochastic Oscillator movings on the chart H1 indicate overbought, one should expect the decrease of the Brent price.
The WTI graph (current price: $ 5556.00 per 100 barrels)
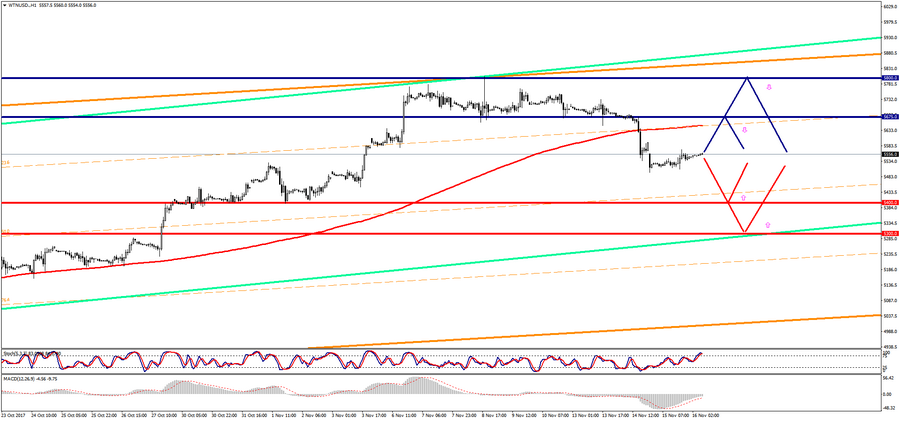
The WTI brand is trading with a small plus during the Asian session.
- Resistance 1: From $ 5675.00 (technical level)
- Resistance 2: From $ 5800.00 (psychological level)
- Support 1: From $ 5400.00 (psychological level)
- Support 2: From $ 5300.00 (psychological level)
Computer analysis: The Stochastic Oscillator movings on the H1 chart indicate overbought of the instruments, one should also expect a decline in the price of WTI oil.