
Technical analysis of gold and silver (Alexander Sivtsov)
Gold chart (current price: $ 1256.30)
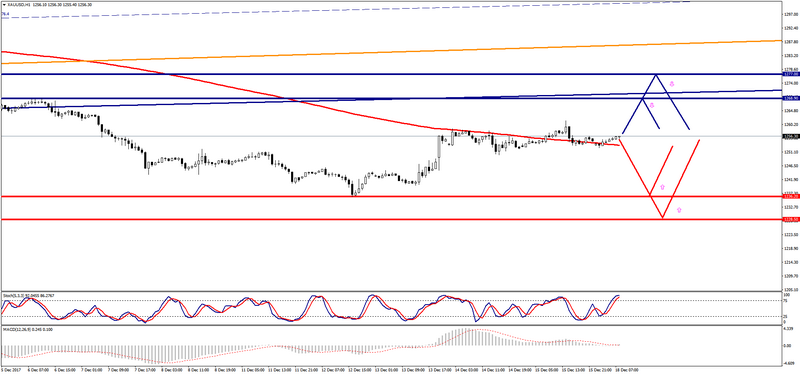
Gold is trading with a small plus during the Asian session.
- Resistance 1: From $ 1268.90 (December 6 maximum)
- Resistance 2: From $ 1277.00 (December 5 maximum)
- Support 1: From $ 1236.20 (technical level)
- Support 2: From $ 1228.50 (technical level)
Computer analysis: The Stochastic Oscillator movings on the chart H1 indicate overbought of the instrument, that is why there may be some reduction in the price of gold.
Silver chart (current price: $ 16.01)
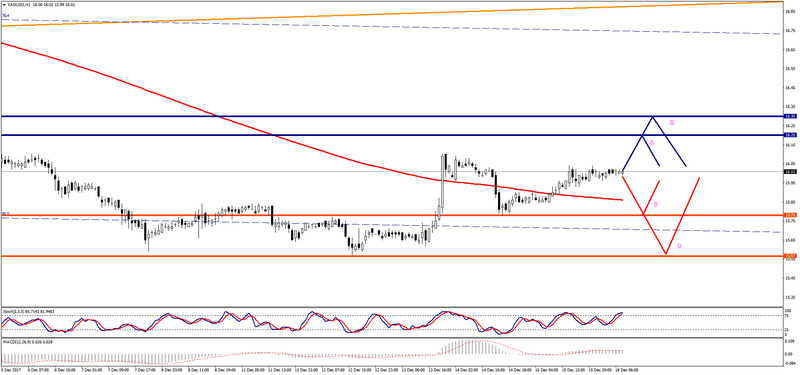
Silver is trading with a plus during the Asian session.
- Resistance 1: From $ 16.20 (December 4 minimum)
- Resistance 2: From $ 16.30 (technical level)
- Support 1: From $ 15.78 (December 14 minimum)
- Support 2: From $ 15.57 (December 12 minimum)
Computer analysis: The Stochastic Oscillator movings on the chart H1 indicate the overbought of the instrument, that is why there may be some reduction in the price of silver.