
Technical Analysis of Oil (Alexander Sivtsov)
Oil is trading above the zero mark in the Asian session.
The Brent graph (current price: $ 6350.60 per 100 barrels)
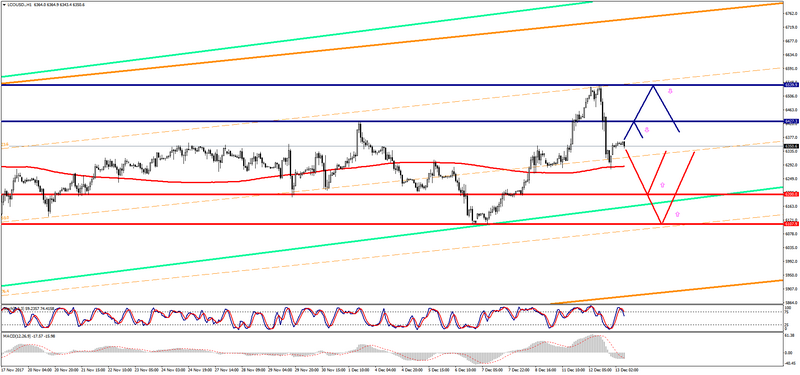
Brand Brent is trading above the zero mark during the Asian session.
- Resistance 1: From $ 6427.30 (December 1 maximum)
- Resistance 2: From $ 6539.90 (December 12 maximum)
- Support 1: From $ 6200.00 (psychological level)
- Support 2: From $ 6107.90 (December 7 minimum)
Computer analysis: The Stochastic Oscillator movings on the H4 chart indicate oversold of the instrument, against which further recovery of the Brent price may be possible.
The WTI graph (current price: $ 5749.40 per 100 barrels)
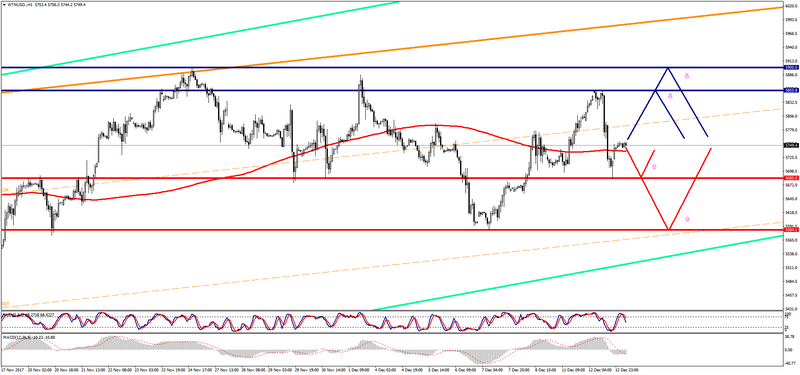
Brand WTI is trading with a plus during the Asian session.
- Resistance 1: From $ 5855.80 (December 12 maximum)
- Resistance 2: From $ 5900.00 (psychological level)
- Support 1: From $ 5685.00 (December 12 minimum)
- Support 2: From $ 5584.10 (December 7 minimum)
Computer analysis: The Stochastic Oscillator movings on the H4 chart indicate the oversold of the instrument, which is why the WTI price may recover, pending the data on oil reserves in the US.