
Technical analysis of gold and silver (Alexander Sivtsov)
Gold chart (current price: $ 1317.60)
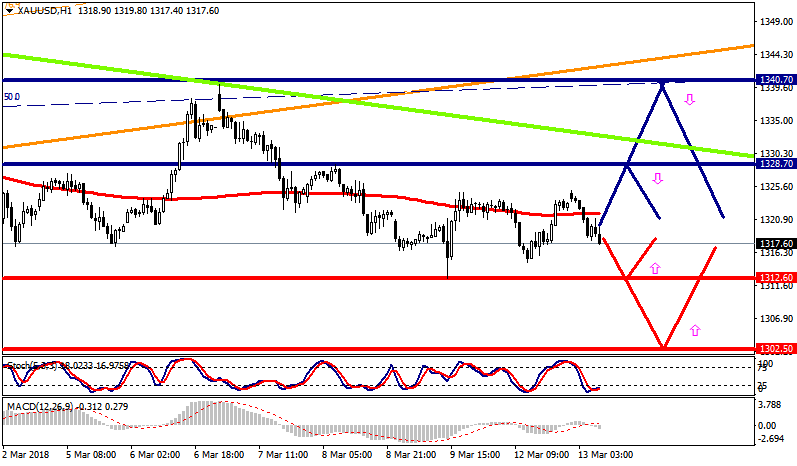
Gold is trading below the zero mark during the Asian session.
- Resistance 1: From $ 1328.70 (March 8 maximum)
- Resistance 2: From $ 1340.70 (February 26 maximum)
- Support 1: From $ 1312.60 (March 9 minimum)
- Support 2: From $ 1302.50 (March 1 minimum)
Computer analysis: The Movings of the Stochastic Oscilliator forex indicator on the chart N1 indicate the oversold of the instrument, so one should expect a growth of the price of gold.
Silver chart (current price: $ 16.43)
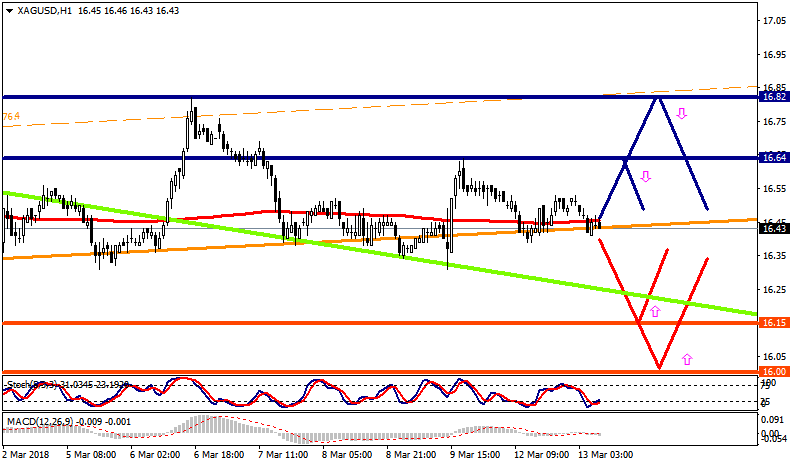
Silver is traded with a small minus during the Asian session.
- Resistance 1: From $ 16.64 (March 9 maximum)
- Resistance 2: From $ 16.82 (March 6 maximum)
- Support 1: From $ 16.15 (technical level)
- Support 2: From $ 16.00 (psychological level)
Computer analysis: The Stochastic Oscillator movings on the H1 chart indicates the oversold of the instrument, so one should expect the restore of the price of silver.