Technical analysis of gold and silver (Alexander Sivtsov)
Gold chart (current price: $ 1279.60)
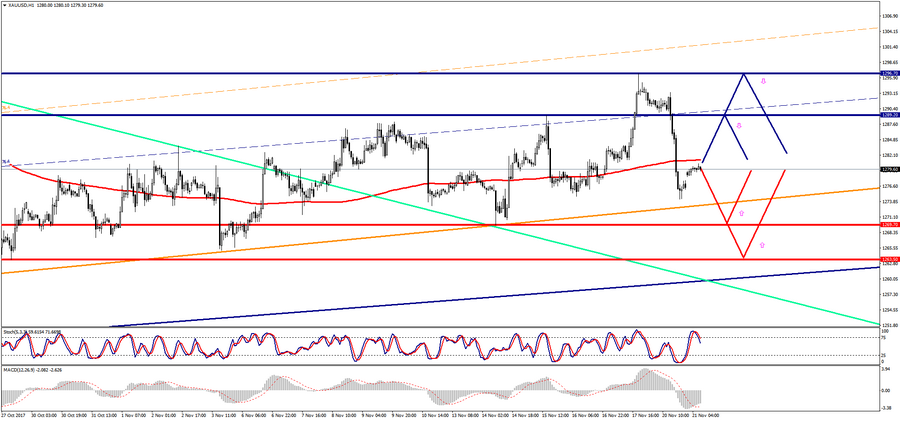
Gold is trading above the zero mark during the Asian session.
- Resistance 1: From $ 1289.20 (November 15 maximum)
- Resistance 2: From $ 1296.70 (October 17 maximum)
- Support 1: From $ 1269.70 (November 14 minimum)
- Support 2: From $ 1263.50 (October 27 minimum)
Computer analysis: The Stochastic Oscillator movings on the H4 chart indicate the oversold of the instrument, that is whyh a recovery in the gold price is possible.
Silver Schedule (current price: $ 16.92)
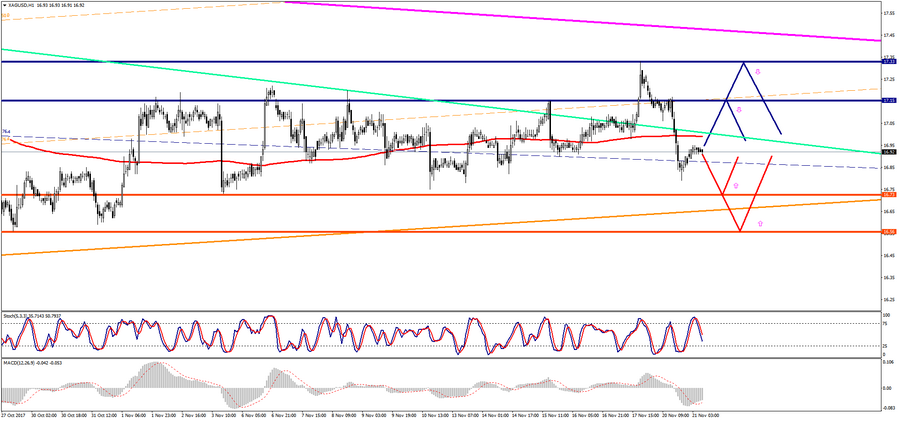
Silver is trading with a plus during the Asian session.
- Resistance 1: From $ 17.15 (November 15 maximum)
- Resistance 2: From $ 17.33 (October 17 maximum)
- Support 1: From $ 16.73 (November 3 minimum)
- Support 2: From $ 16.56 (October 27 minimum)
Computer analysis: The Stochastic Oscillator movings on the chart H4 indicate the oversold of the instrument, one can expect a possible recovery in the silver price.