
Technical analysis of gold and silver (Alexander Sivtsov)
Gold chart (current price: $ 1274.90)
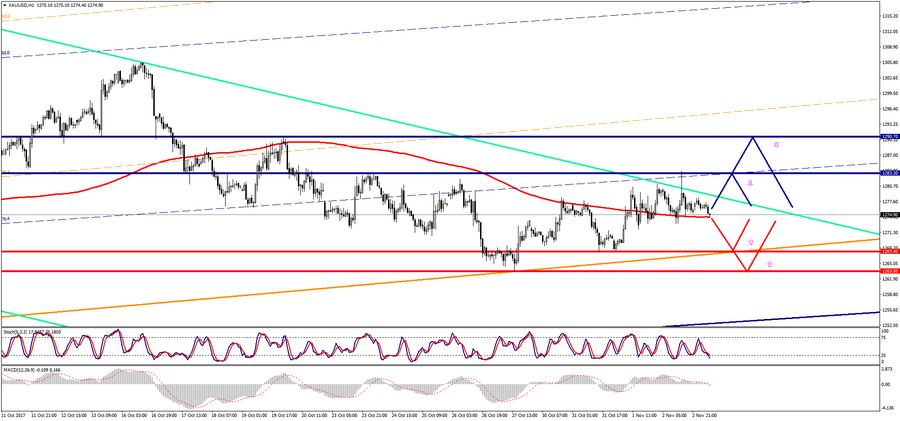
Gold is trading with a small minus during the Asian session.
Resistance 1: From $ 1283.30 (October 24 maximum)
Resistance 2: From $ 1290.70 (October 20 maximum)
Support 1: From $ 1267.40 (October 31 minimum)
Support 2: From $ 1263.50 (October 27 minimum)
Computer analysis: the Stochastic Oscillator movings on the H4 chart are in the neutral zone. One should expect the continuation of the price movement of gold in the flat range before the American session.
Silver chart (current price: $ 17.05)
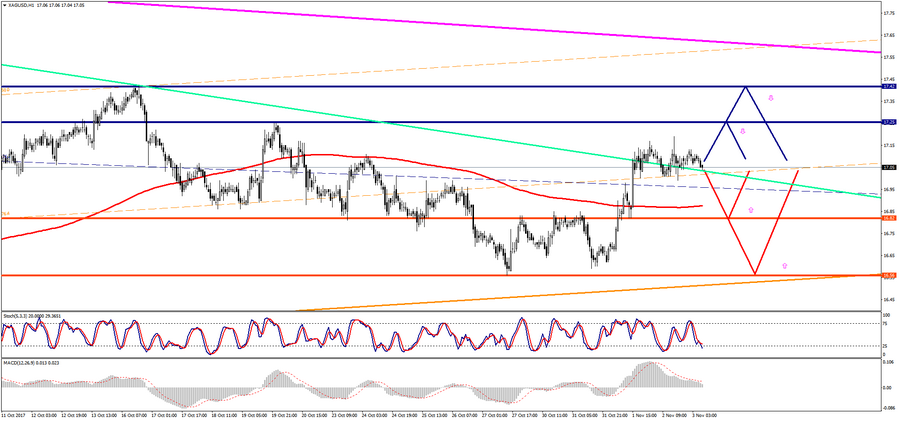
Silver is trading below the zero mark during the Asian session.
Resistance 1: From $ 17.25 (October 20 maximum)
Resistance 2: From $ 17.42 (October 16 maximum)
Support 1: From $ 16.82 (technical level)
Support 2: From $ 16.56 (October 27 minimum)
Computer analysis: the Stochastic Oscillator movings on the H4 chart are also in the neutral zone, so the situation can be similar to gold.