
Тechnical analysis of currency pairs (Anton Hanzenko)
EUR USD (current price: 1.2280)
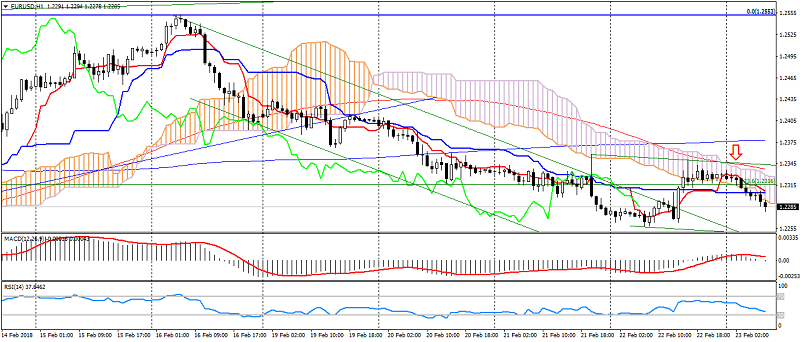
- Support levels: 1.2100 (September-September maximum), 1.1900, 1.1700.
- Resistance levels: 1.2600, 1.2750 (March 2013 minimum), 1.2270 (November 2014 minimum).
- Computer analysis: MACD (12,26,9) (signal-outflow): the indicator is above 0, the signal line has left the histogram bar. RSI (14) in the oversold zone. IchimokuKinkoHyo (9,26,52) (signal – downward movement): the Tenkan-sen line is below the Kijun-sen line, the price is below the cloud.
- The main recommendation: entrance for sale from 1.2300, 1.2340, 1.2360.
- Alternative recommendation: buy entry from 1.2260, 1.2240, 1.2200.
The euro-dollar pair resumed the decline early in the day on the American recovery, but at the same time is limited to oversold and forthcoming data on the euro area.
GBP USD (current price: 1.3930)
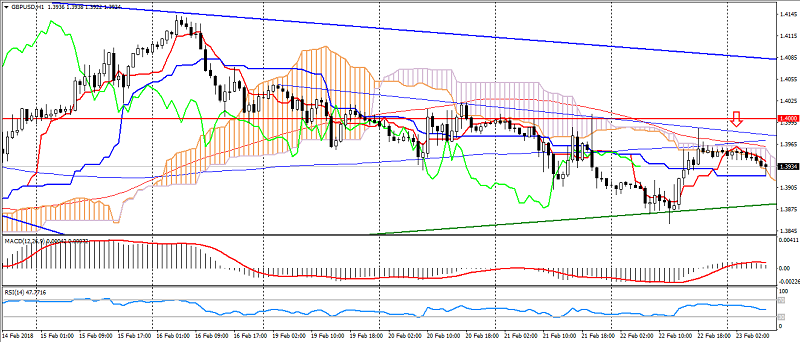
- Support levels: 1.4000 (low of April 2016), 1.3820, 1.3650 (September 2017 maximum).
- Resistance levels: 1.4350, 1.4500, 1.4750 (May May 2016 maximum).
- Computer analysis: MACD (12,26,9) (signal – downward movement): the indicator is above 0, the signal line has left the histogram bar. RSI (14) in the neutral zone. IchimokuKinkoHyo (9,26,52) (signal – downward movement): the Tenkan-sen line is below the Kijun-sen line, the price is below the cloud.
- The main recommendation: entrance for sale from 1.3980, 1.4000, 1.4030.
- Alternative recommendation: the entrance to the purchase from 1.3900, 1.3870, 1.3840.
The British pound also weakened at the resumption of the growth of the American, but the pair is still clamped in the side triangle.
USD CHF (current price: 0.9360)
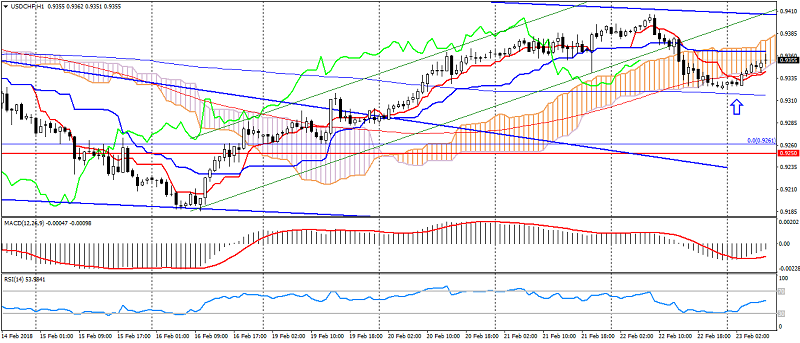
- Support levels: 0.9250 (August 2015 minimum), 0.9150, 0.9050 (May 2015 minimum).
- Resistance levels:, 0.9550, 0.9800, 1.0030 (November 2017 high).
- Computer analysis: MACD (12,26,9) (signal – upward movement): the indicator is below 0, the signal line has left the histogram bar. RSI (14) in the neutral zone. IchimokuKinkoHyo (9,26,52) (signal – downward movement, flat): the Tenkan-sen line below the line Kijun-sen, the price in the cloud.
- The main recommendation: entry for sale from 0.9360, 0.9380, 0.9410.
- Alternative recommendation: buy entry from 0.9320, 0.9300, 0.9260.
The Swiss franc markedly corrected the weakness of the American, but remains a generally upward trend.
USD JPY (current price: 107.00)
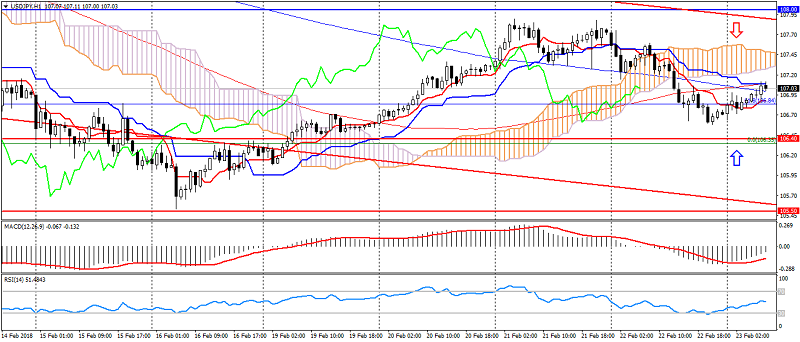
- Support levels: 106.40, 105.50, 104.50.
- Levels of resistance: 108.00, 108.60, 110.00.
- Computer analysis: MACD (12, 26, 9) (signal – upward movement): the indicator is below 0, the signal line has left the histogram bar. RSI (14) in the neutral zone. IchimokuKinkoHyo (9,26,52) (signal-going traffic): the Tenkan-sen line is below the Kijun-sen line, the price is below the cloud.
- The main recommendation: entrance for sale from 107.40, 107.70, 108.00.
- Alternative recommendation: the entrance to the purchase is from 106.70, 106.40, 106.00.
The Japanese yen receives support on the flight of investors from risks and maintaining the annual downtrend.
USD CAD (current price: 1.2710)
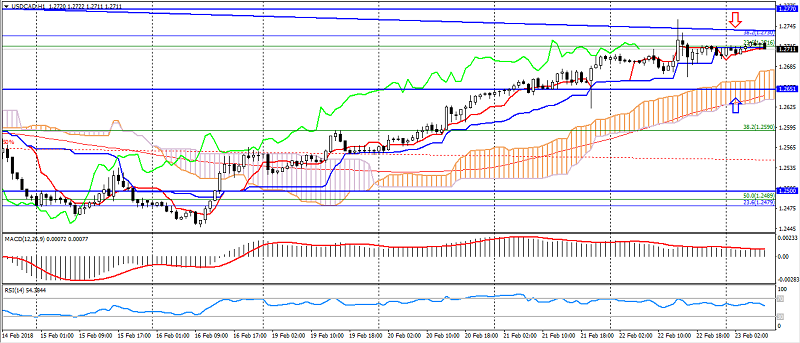
- Support levels: 1.2340.1.2200, 1.2060 (at least 2017).
- Resistance levels: 1.2500, 1.2650, 1.2770 (August 2017 maximum).
- Computer analysis: MACD (12, 26, 9) (signal – upward movement): indicator above 0, signal line in the body of the histogram. RSI (14) in the neutral zone. IchimokuKinkoHyo (9,26,52) (signal – upward movement): the Tenkan-sen line above the Kijun-sen line, the price is higher than the cloud.
- The main recommendation: entrance for sale from 1.2730, 1.2750, 1.2780.
- Alternative recommendation: entry to buy from 1.2680, 1.2650, 1.2620.
The Canadian dollar continues to remain under the pressure of the weekly downtrend, limited to overbought and resistance levels of 1.277.
AUD USD (current price: 0.7820)
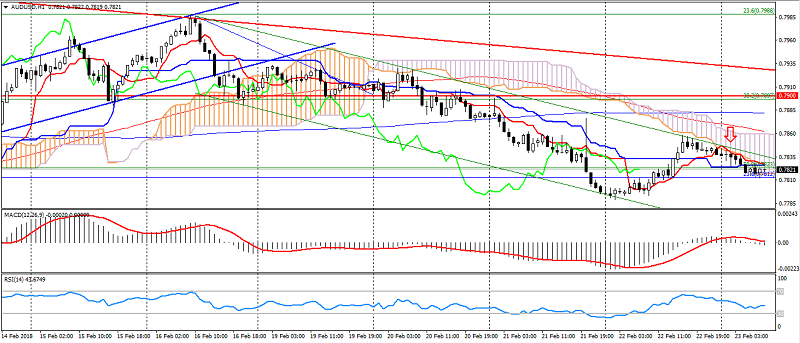
- Support levels: 0.7900, 0.7700 (March 2017 maximum), 0.7500.
- Resistance levels: 0.8120 (2017 maximum), 0.8200, 0.8290 (2014 maximum).
- Computer analysis: MACD (12, 26, 9) (signal – upward movement): indicator above 0, signal line in the body of the histogram. RSI (14) in the neutral zone. IchimokuKinkoHyo (9,26,52) (signal – downward movement): the Tenkan-sen line is below the Kijun-sen line, the price is below the cloud.
- The main recommendation: the entrance is for sale from 0.7850, 0.7880, 0.7900.
- Alternative recommendation: buy-in from 0.7810, 0.7790, 0.7760.
The Australian maintains a steady weekly downtrend.
NZD USD (current price: 0.7300)
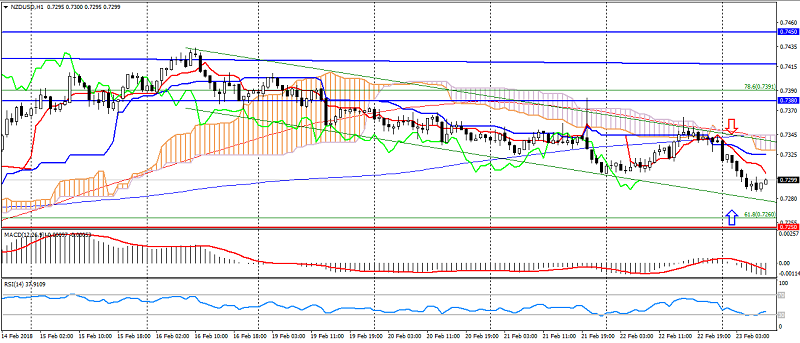
- Support levels: 0.7250, 0.7130 (the minimum of August 2017), 0.7000.
- Resistance levels: 0.7380, 0.7450, 0.7550 (maximum of 2017).
- Computer analysis: MACD (12, 26, 9) (signal -existing motion): the indicator is below 0, the signal line in the body of the histogram RSI (14) in the neutral zone. IchimokuKinkoHyo (9,26,52) (signal – downward movement): the line Tenkan-sen below the line Kijun-sen, the price in the cloud.
- The main recommendation: entrance for sale from 0.7320, 0.7340, 0.7380.
- Alternative recommendation: the entrance to the purchase is from 0.7280, 0.7260, 0.7240.
The New Zealand dollar maintains a downtrend, but is limited to a significant oversold, which may cause a correction.
XAU USD (current price: 1327.00)
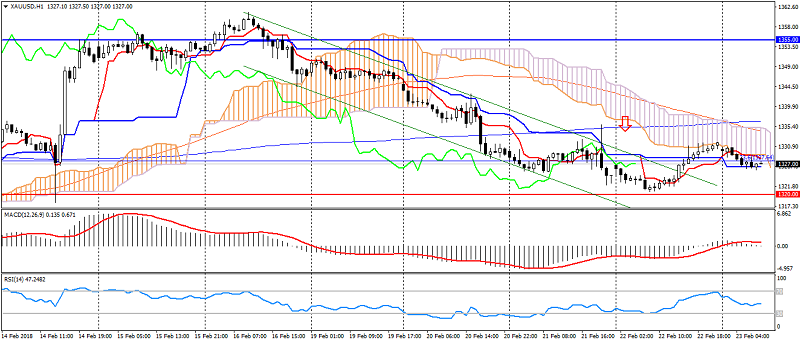
- Support levels: 1320.00, 1303.00, 1280.00.
- Resistance levels: 1355.00 (May May 2016 maximum), 1374.00, 1290.00 (March 2016 maximum).
- Computer analysis: MACD (12, 26, 9) (signal – downward movement): the indicator is above 0, the signal line has left the histogram bar. RSI (14) in the neutral zone. IchimokuKinkoHyo (9,26,52) (signal-outflow): the Tenkan-sen line below the Kijun-sen line, the price in the clouds.
- The main recommendation: entrance for sale from 1333.00, 1336.00, 1340.00.
- Alternative recommendation: the entrance to the purchase from 1323.00, 1320.00, 1316.00.
Gold went into the correction phase after the decline, but continues to form the second top of the figure “double top”.