A bird in the hand or a crane in the sky? Future tightening from the ECB or acting one from the Fed, which is stronger? Forecast for the week for the pair EUR/USD.
Good afternoon, and have a good trading week, my dear readers and traders
of the international currency market ForEx. With you a lover of morning tea
and vigorous trading at night – Andrew Green.
Each of us has our own alarm clock, which helps to plan and organize a working day. For someone it’s an alarm clock in a smartphone, for some – children, for someone – pets, and for a real trader – it’s alerts in key areas of resistance and support). Nothing so invigorates as the sound confirming the closing of the transaction, well, take profit or stop loss – this is more of a deposit for the mood for the day).
What can we expect from a single European currency this week. In this article, we will examine what is on the international financial scene and what was outlined on the charts and candles.
The news background, in terms of economic indicators for the euro area and the US, is virtually neutral. Of the key indicators, there is really nothing to expect. And what is interesting is the minutes of the previous FOMC meetings (21.02.18, 19:00 UTC) and the ECB (22.02.18, 12:30 UTC). From the first one, influence, most likely, will be more.
But what can we learn about the new protocol from the meetings that already took place 4 weeks ago.
FOMC – the target benchmarks of the participants to decide on raising the discount rate, whether the views of specific people have changed, or whether the internal distribution of “hawks” and “owls” has remained unchanged.
ECB – most likely the impact will be minimal, the probability of something new is almost zero. What can cause a reaction is the specifics of the timing and size of the possible curtailment of the quantitative easing program.
To a greater extent, external influences on the dynamics of the pair will be centered around the US stock market and investor sentiment in terms of risks and security. You can find more details in the article about the weekly forecast for the USD-DXH index.
And here is the turn of technical analysis! Let’s start with the graph of the average period, namely the timeframe of the day (Figure 1).
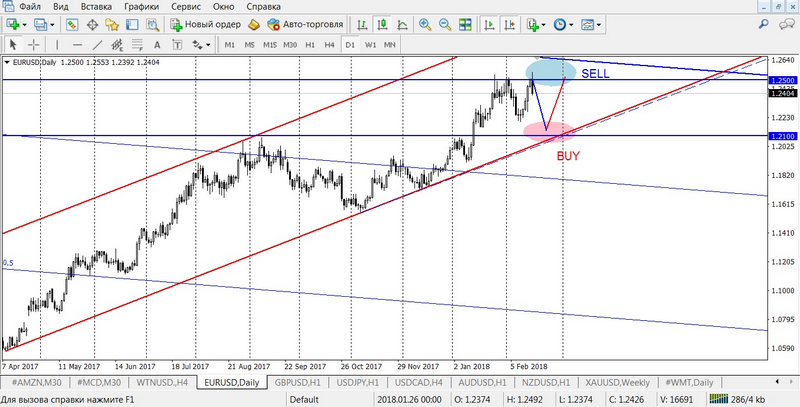
As we can see, following the results of the previous week, the pair re-tested the level of 1.2500 and, having reached a maximum at 1.2553, rebounded quite cheerfully by 150 points to 1.2400. In general, this is a good confirmation for sales in the area of 1.2500-1.2550. But be careful – this is essentially the fourth touch of the resistance zone and the probability of a breakdown is quite high, consider the stop-loss and clipping in the area of 1.2570-80.
If next week we see a rollback to the lows of the past at 1.2200, then here is formed a very beautiful, almost like in a textbook, a reversal pattern – the Double Top, with the potential to continue moving down to levels of 1.1900-1800. In a word, a tempting option of the development of events, but do not forget one of the main rules of trade on the figures of technical analysis – we always wait for a clear signal that confirms the working off of the figure! If you are not familiar with these rules, then study the possibilities of our individual training courses on the partner website of Ester Holdings Inc.
But, until the moment of breakdown, the zone 1.21-1.2200 is a good zone for continuing the growing dynamics of the pair. For trading on the purchase, I recommend that you stock yourself with patience and enter the deal only after candle confirmation for growth, at least on the H4 timeframe.
Further analysis for the fans of intraday trading, go to the hour chart (Figure 2).

Here we have several interesting zones:
- The sales area is at the highs of 1.2500-1.2550, which we already mentioned earlier.
- The shopping area at 1.2400 is the support line for the upward dynamics of the previous week and the psychological level. In general, a very good option for a short-term deal with benchmarks of 30-40 points.
- Purchasing area 1.2200 – last week’s lows. Before the breakdown, they should be safely used as a support and a reference point for bullish bargains on a pair.
Examples of transactions:
- SELL limit 1.2520, SL 1.2570, TP 1.2440.
- BUY limit 1.2400, SL 1.2370, TP 1.2440.
- BUY limit 1.2220, SL 1.2150, TP 1.2350.
The trader’s income in the market is not the result of movement, there is always movement …
The trader’s income is the ability to make decisions on time. Do not brake …)
Andrew Green