Brexit pitfalls. Analysis of the speech by Theresa May on 02/03/2018. Weekly review of the GBP/USD pair.
Good afternoon, my friends and colleagues in the world of exchange trading.
With you Andrew “Golden Eye” Green.
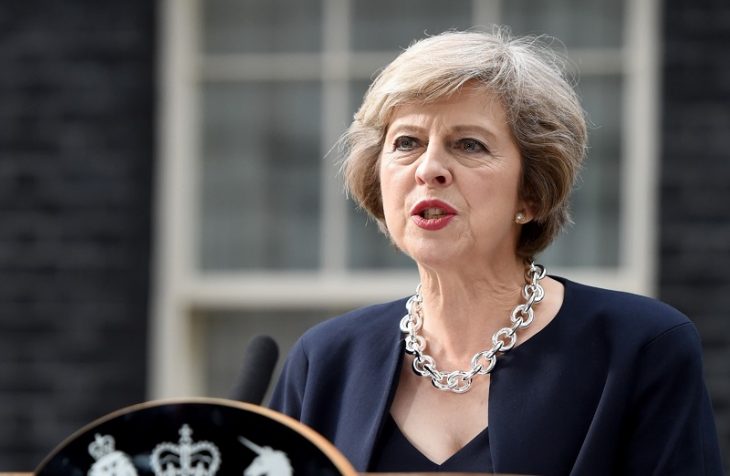
What’s new was said on this Friday (March 2, 2018) and, most importantly, what was not said and what questions remained unanswered after the speech of British Prime Minister Theresa May in London?
If you move away from the large number of words used during the press conference, and focus on the main, the key phrase to describe the situation will be – NOTHING TO UNDERSTAND.
None of the participants yet have a clear understanding of the conditions on which the British exit from the European Union will take place. But the fact that it will take place seems to have become obvious to everyone.
There are several main directions of the speech:
- Internal confrontation among the Conservative Party. The Prime Minister needed to state a position that would give the opportunity to try the ruling party from within. To give the necessary message both for the followers of Brexit and for the pro-European party members. In a greater degree she succeeded. The first was satisfied with a clear position on the impossibility of maintaining a customs union with the EU on the current conditions. For the opponents, the conciliatory factor was a clear vision of the impossibility of concluding an agreement on withdrawal from the European Union with a “closed visor”, that is, in full and unconditional defense of maximalist requests for the need to find a compromise for further business with Europe, after Brexit. As a result, the former continue to support it, while others have given time to create acceptable conditions for withdrawal from the EU.
- Demonstration of a firm position and an unconditional attitude for European leaders to continue the Brexit procedure and readiness to negotiate, but not on any terms. In a word, the tone of the talks has become more peaceful, but has not ceased to be clear.
In general, from the position of fundamental analysis, one can distinguish two main factors influencing the current dynamics of the British pound.
1.Negative consequences and risks of uncertainty in connection with withdrawal from the European Union.
2.Positive economic indicators and the policy of the Bank of England aimed at further strengthening and tightening monetary policy.
Both factors are multidirectional and strong enough to provide a periodic influence on the general trends and trends of the GBP.
In order to fully appreciate the weekly outlook for the GBP/USD pair, I also recommend that you familiarize yourself with the weekly forecast for USD.
In order to see the light at the end of the British Tunnel, let’s move to the technical analysis environment.
Let’s start with figure 1 and monthly timeframe.
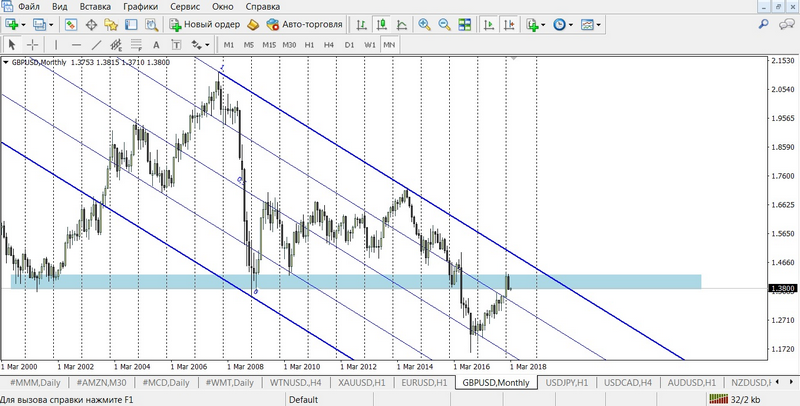
February 2018 is already behind and on the monthly chart a very interesting downward candle has closed. If we also take into account that the formation of this candle began near a very strong resistance range of 1.43-1.45, then it is worth considering this signal as a high probability of subsequent correction in the downward direction, towards the reference points at 1.3300. Where I took this price level will become clear when we look at Figure 2 and the weekly chart with the red line support line, which is exactly at these price positions.
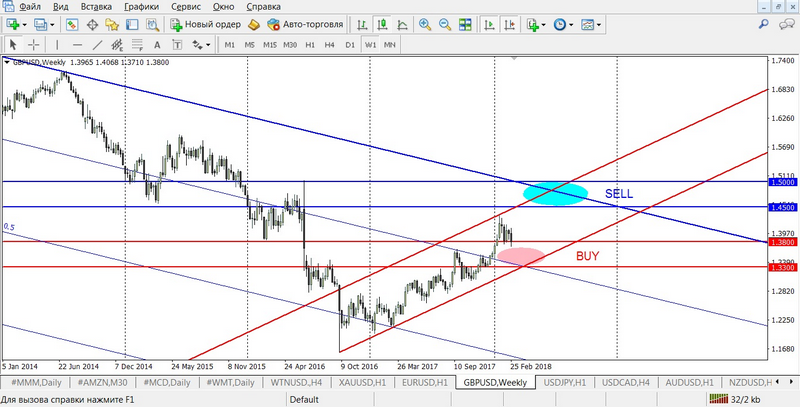
These levels are interesting because in 2016, immediately after the referendum, they became the key resistance line for almost a year, and at the beginning of the winter of 2017-2018, this level was the foundation for the subsequent 6-week growth to the highs to 1.43. So I recommend to use this level and a range of 1.33-1.35 for medium-term purchases bon the pair.
As for short-term trading, then more convenient and useful will be the figure 3 and daily timeframe.
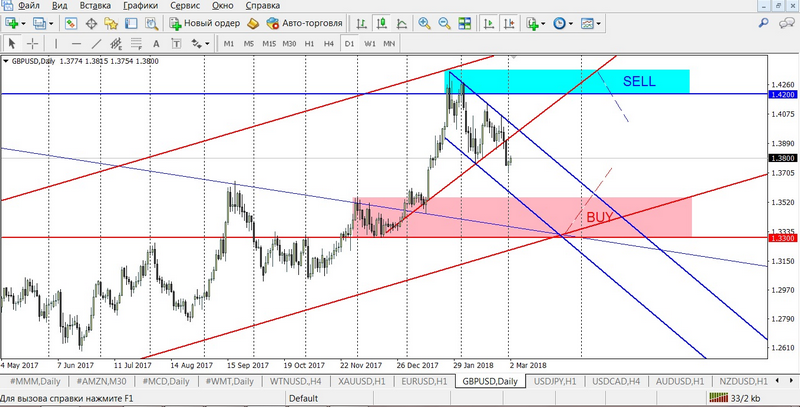
Here everything is quite simple. All the same level of 1.3300, as a guide for purchase. And the upper range is from the level of 1.4200, as the entrance zone for sales. A downward correction is clearly visible, but it is still under question due to strong buying sentiments. We are waiting for a clear consolidation below 1.3800 and further decline.
Now the main part of the analysis for the current trade is Figure 4 and the hour timeframe.
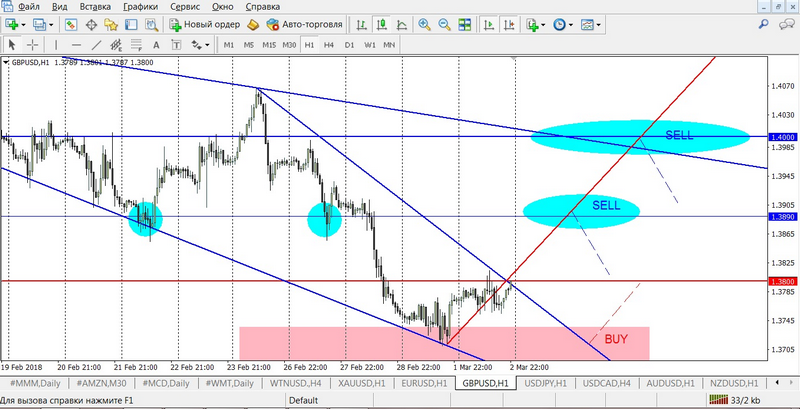
There are three main trade areas:
- purchases from 1.3700 – last week’s lows;
- sales from the ranges 1.3890-13920;
- sale from the level of 1.4000 – a strong psychological level.
Examples of transactions:
- conservative option:
BUY limit 1.3710, SL 1.3670, TP 1.3780;
SELL limit 1.3980, SL 1.4030, TP 1.3920. - aggressive option:
SELL limit 1.3890, SL 1.3930, TP 1.3840.
Trade on the exchange is not just a profit – it’s a way of life for those,
who is not afraid to make decisions.
Andrew Green